 mundialis GeoNetwork catalogue
Type of resources
Available actions
Topics
INSPIRE themes
Keywords
Contact for the resource
Provided by
Formats
Representation types
Update frequencies
status
Scale
Resolution
-
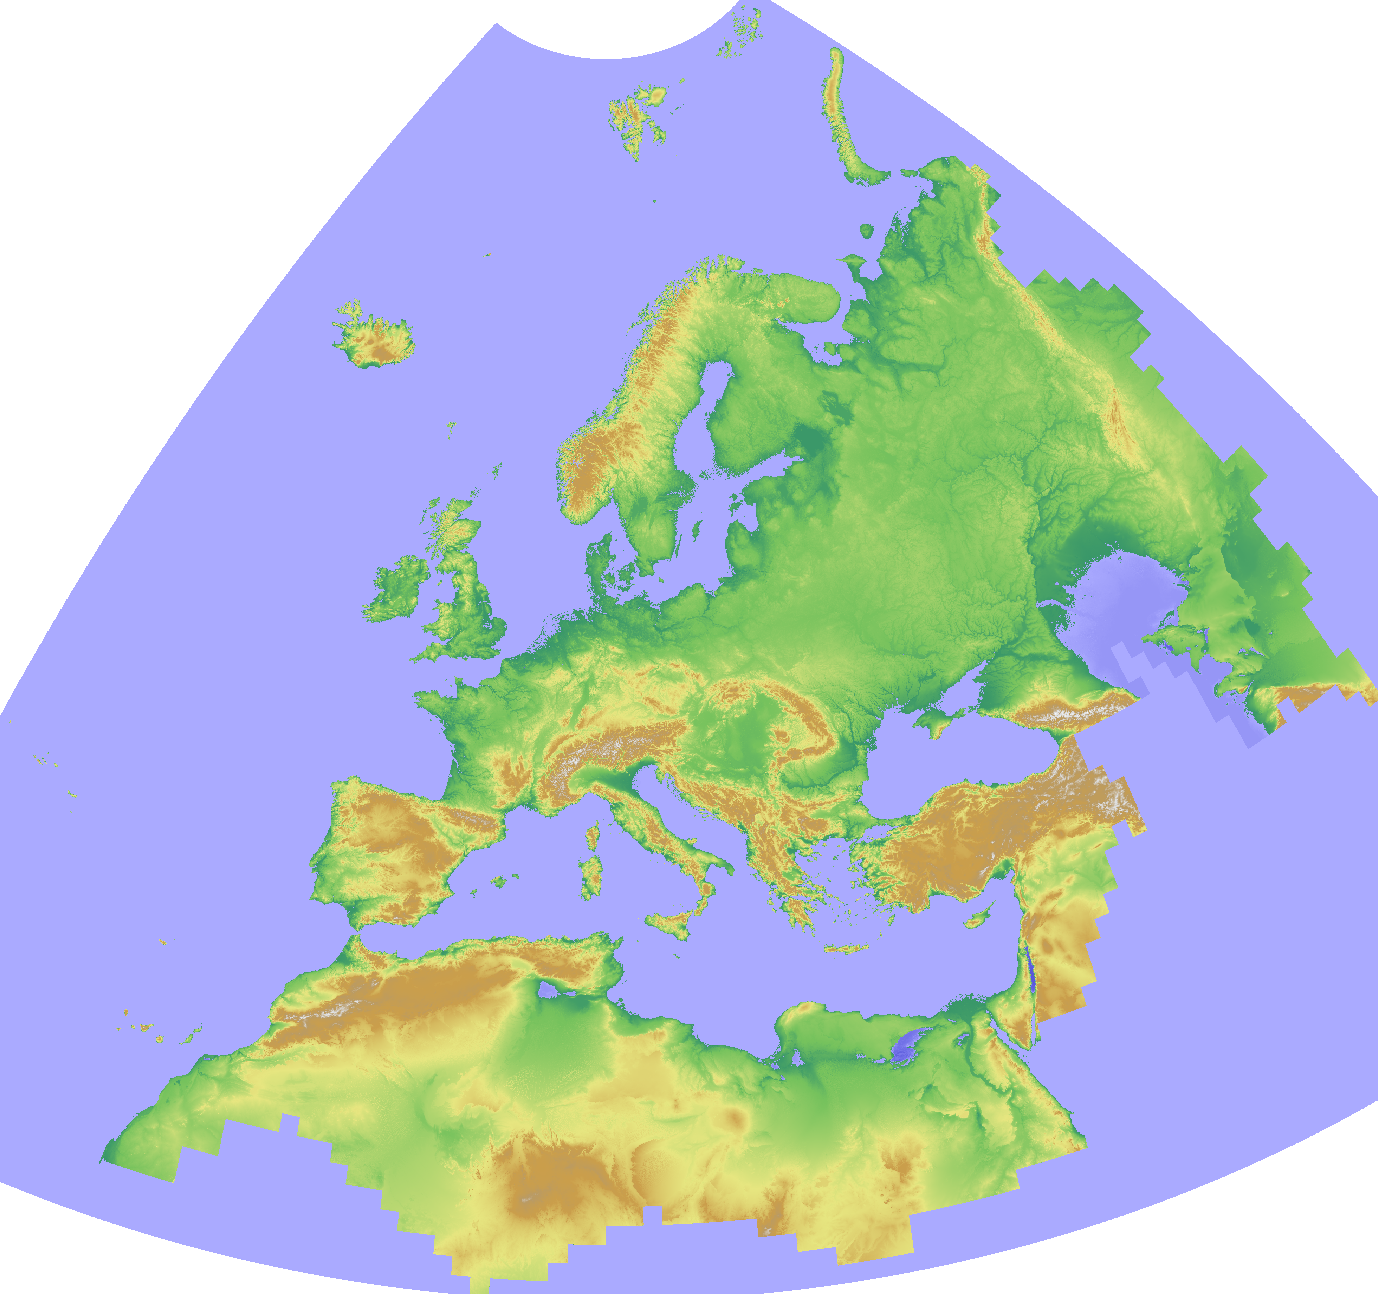
The Copernicus DEM is a Digital Surface Model (DSM) which represents the surface of the Earth including buildings, infrastructure and vegetation. The original GLO-30 provides worldwide coverage at 30 meters (refers to 10 arc seconds). Note that ocean areas do not have tiles, there one can assume height values equal to zero. Data is provided as Cloud Optimized GeoTIFFs. Note that the vertical unit for measurement of elevation height is meters. The Copernicus DEM for Europe at 30 meter resolution (EU-LAEA projection) in COG format has been derived from the Copernicus DEM GLO-30, mirrored on Open Data on AWS, dataset managed by Sinergise (https://registry.opendata.aws/copernicus-dem/). Processing steps: The original Copernicus GLO-30 DEM contains a relevant percentage of tiles with non-square pixels. We created a mosaic map in https://gdal.org/drivers/raster/vrt.html format and defined within the VRT file the rule to apply cubic resampling while reading the data, i.e. importing them into GRASS GIS for further processing. We chose cubic instead of bilinear resampling since the height-width ratio of non-square pixels is up to 1:5. Hence, artefacts between adjacent tiles in rugged terrain could be minimized: gdalbuildvrt -input_file_list list_geotiffs_MOOD.csv -r cubic -tr 0.000277777777777778 0.000277777777777778 Copernicus_DSM_30m_MOOD.vrt In order to reproject the data to EU-LAEA projection, bilinear resampling was performed in GRASS GIS (using r.proj) and the pixel values were scaled with 1000 (storing the pixels as Integer values) for data volume reduction. In addition, a hillshade raster map was derived from the resampled elevation map (using r.relief, GRASS GIS). Eventually, we exported the elevation and hillshade raster maps in Cloud Optimized GeoTIFF (COG) format, along with SLD and QML style files. Note that GLO-30 Public provides limited coverage at 30 meters because a small subset of tiles covering specific countries are not yet released to the public by the Copernicus Programme. Note that ocean areas do not have tiles, there one can assume height values equal to zero. Data is provided as Cloud Optimized GeoTIFFs.
-
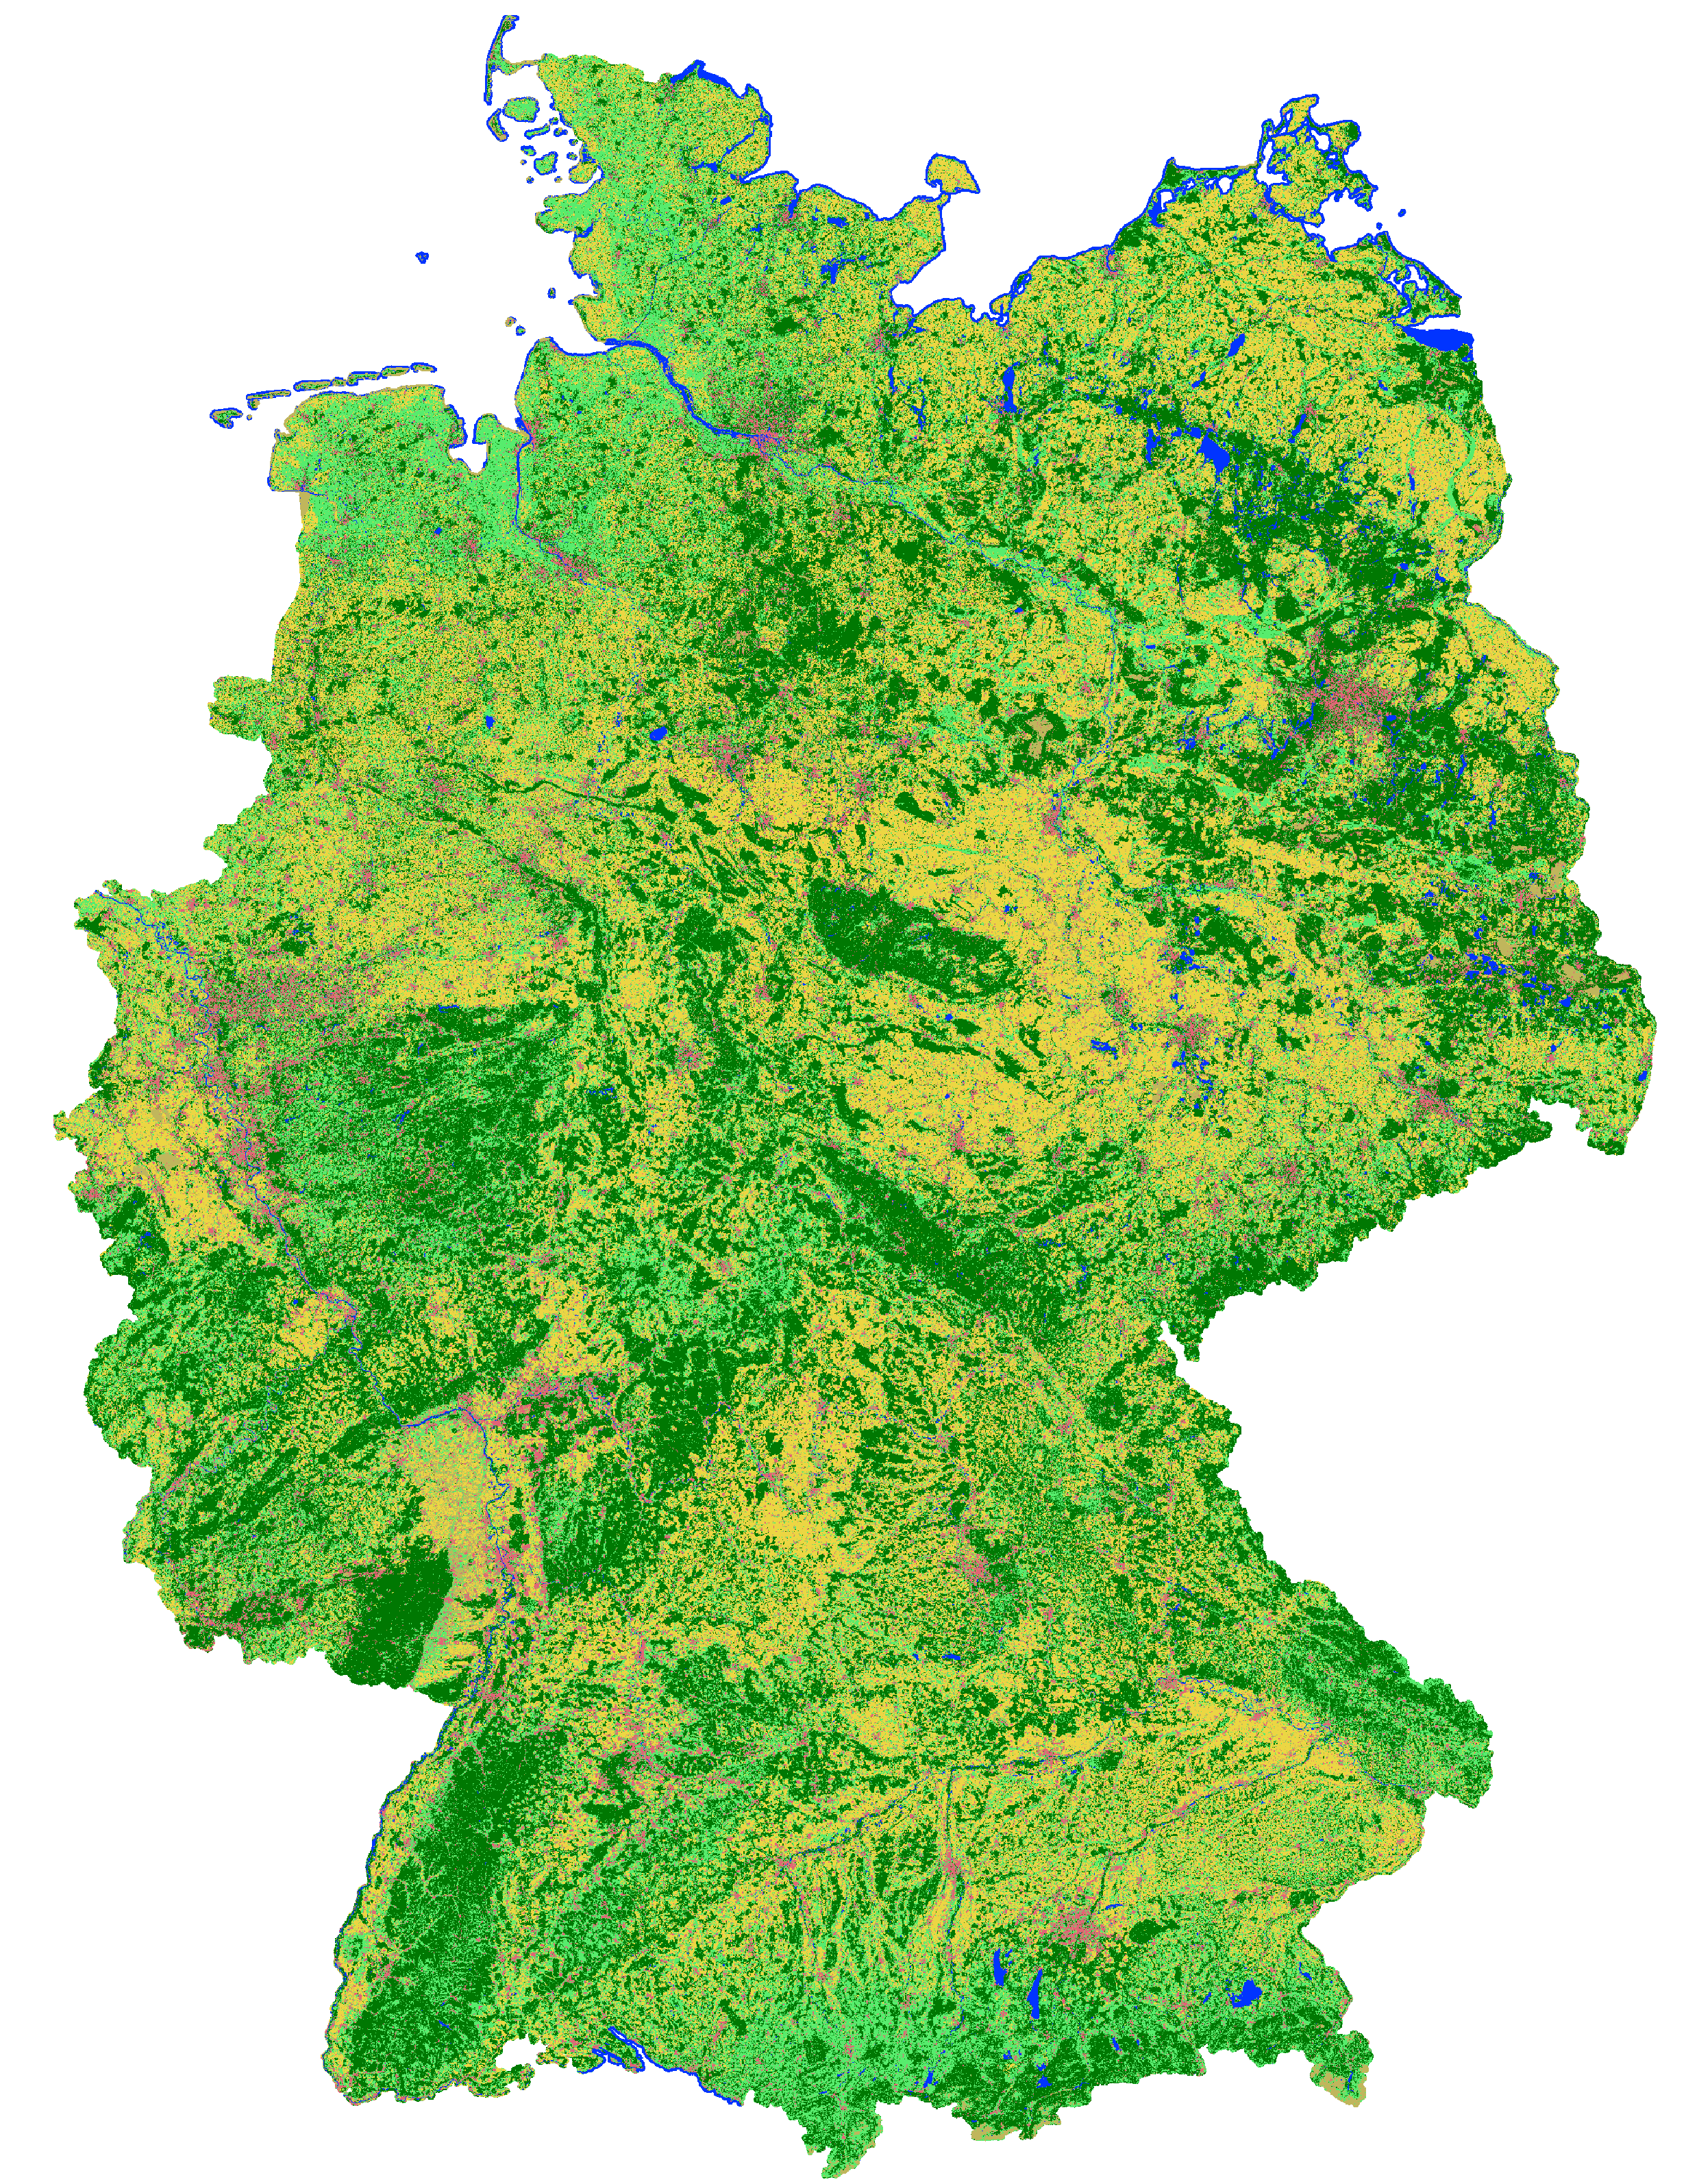
This landcover map was produced as an intermediate result in the course of the project incora (Inwertsetzung von Copernicus-Daten für die Raumbeobachtung, mFUND Förderkennzeichen: 19F2079C) in cooperation with ILS (Institut für Landes- und Stadtentwicklungsforschung gGmbH) and BBSR (Bundesinstitut für Bau-, Stadt- und Raumforschung) funded by BMVI (Federal Ministry of Transport and Digital Infrastructure). The goal of incora is an analysis of settlement and infrastructure dynamics in Germany based on Copernicus Sentinel data. This classification is based on a time-series of monthly averaged, atmospherically corrected Sentinel-2 tiles (MAJA L3A-WASP: https://geoservice.dlr.de/web/maps/sentinel2:l3a:wasp; DLR (2019): Sentinel-2 MSI - Level 2A (MAJA-Tiles)- Germany). It consists of the following landcover classes: 10: forest 20: low vegetation 30: water 40: built-up 50: bare soil 60: agriculture Potential training and validation areas were automatically extracted using spectral indices and their temporal variability from the Sentinel-2 data itself as well as the following auxiliary datasets: - OpenStreetMap (Map data copyrighted OpenStreetMap contributors and available from htttps://www.openstreetmap.org) - Copernicus HRL Imperviousness Status Map 2018 (© European Union, Copernicus Land Monitoring Service 2018, European Environment Agency (EEA)) - S2GLC Land Cover Map of Europe 2017 (Malinowski et al. 2020: Automated Production of Land Cover/Use Map of Europe Based on Sentinel-2 Imagery. Remote Sens. 2020, 12(21), 3523; https://doi.org/10.3390/rs12213523) - Germany NUTS administrative areas 1:250000 (© GeoBasis-DE / BKG 2020 / dl-de/by-2-0 / https://gdz.bkg.bund.de/index.php/default/nuts-gebiete-1-250-000-stand-31-12-nuts250-31-12.html) - Contains modified Copernicus Sentinel data (2019), processed by mundialis Processing was performed for blocks of federal states and individual maps were mosaicked afterwards. For each class 100,000 pixels from the potential training areas were extracted as training data. An exemplary validation of the classification results was perfomed for the federal state of North Rhine-Westphalia as its open data policy allows for direct access to official data to be used as reference. Rules to convert relevant ATKIS Basis-DLM object classes to the incora nomenclature were defined. Subsequently, 5.000 reference points were randomly sampled and their classification in each case visually examined and, if necessary, revised to obtain a robust reference data set. The comparison of this reference data set with the incora classification yielded the following results: overall accuracy: 91.9% class: user's accuracy / producer's accuracy (number of reference points n) forest: 98.1% / 95.9% (1410) low vegetation: 76.4% / 91.5% (844) water: 98.4% / 92.8% (69) built-up: 99.2% / 97.4% (983) bare soil: 35.1% / 95.1% (41) agriculture: 95.9% / 85.3% (1653) Incora report with details on methods and results: pending
-
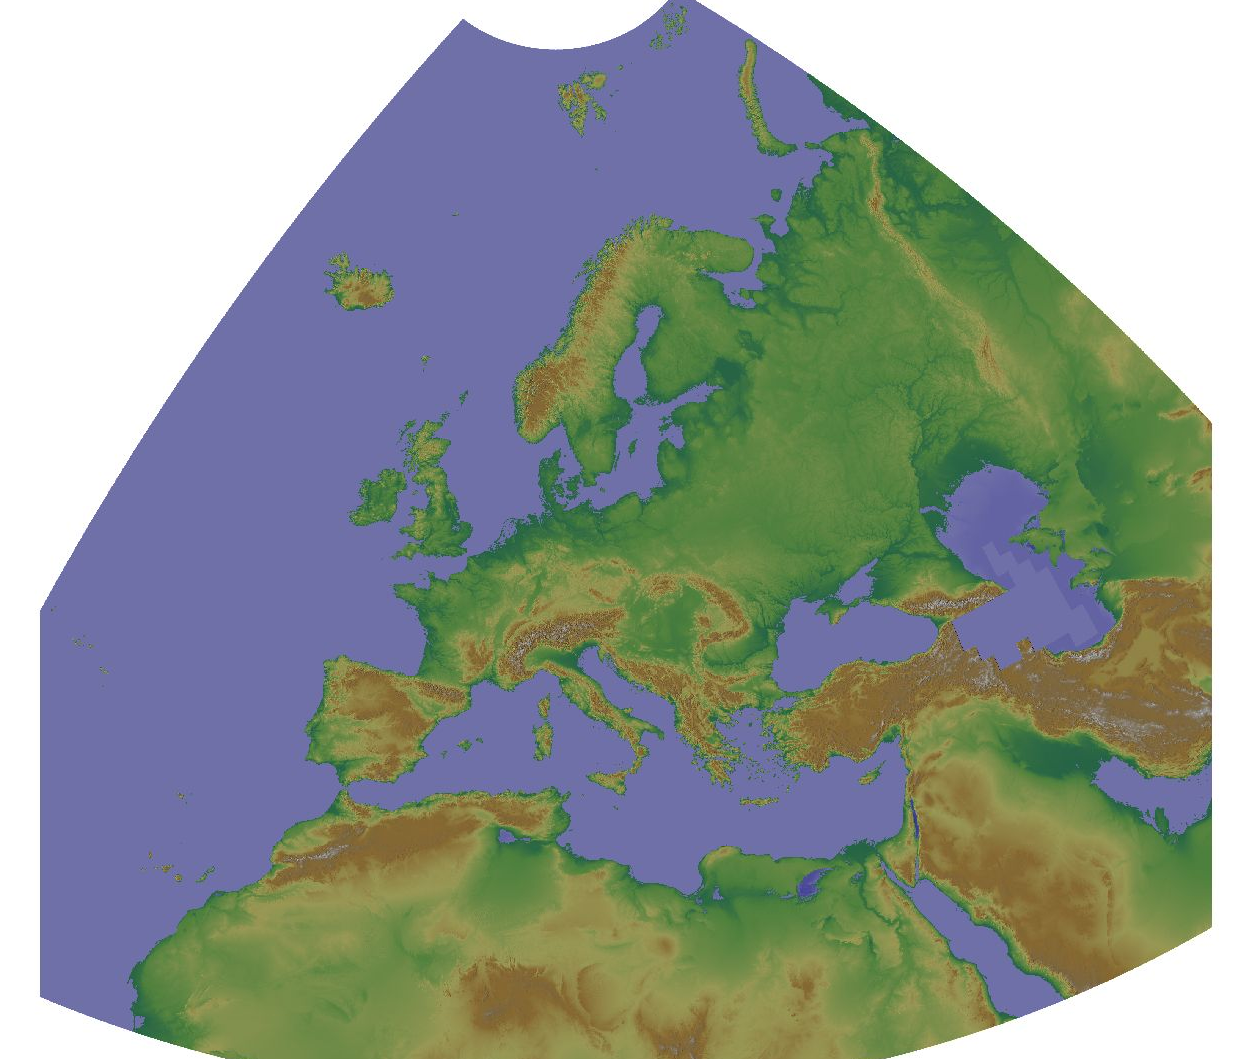
The Copernicus DEM is a Digital Surface Model (DSM) which represents the surface of the Earth including buildings, infrastructure and vegetation. The original GLO-30 provides worldwide coverage at 30 meters (refers to 10 arc seconds). Note that ocean areas do not have tiles, there one can assume height values equal to zero. Data is provided as Cloud Optimized GeoTIFFs. Note that the vertical unit for measurement of elevation height is meters. The Copernicus DEM for Europe at 1000 meter resolution (EU-LAEA projection) in COG format has been derived from the Copernicus DEM GLO-30, mirrored on Open Data on AWS, dataset managed by Sinergise (https://registry.opendata.aws/copernicus-dem/). Processing steps: The original Copernicus GLO-30 DEM contains a relevant percentage of tiles with non-square pixels. We created a mosaic map in https://gdal.org/drivers/raster/vrt.html format and defined within the VRT file the rule to apply cubic resampling while reading the data, i.e. importing them into GRASS GIS for further processing. We chose cubic instead of bilinear resampling since the height-width ratio of non-square pixels is up to 1:5. Hence, artefacts between adjacent tiles in rugged terrain could be minimized: gdalbuildvrt -input_file_list list_geotiffs_MOOD.csv -r cubic -tr 0.000277777777777778 0.000277777777777778 Copernicus_DSM_30m_MOOD.vrt In order to reproject the data to EU-LAEA projection while reducing the spatial resolution to 1000 m, bilinear resampling was performed in GRASS GIS (using r.proj) and the pixel values were scaled with 1000 (storing the pixels as Integer values) for data volume reduction. In addition, a hillshade raster map was derived from the resampled elevation map (using r.relief, GRASS GIS). Eventually, we exported the elevation and hillshade raster maps in Cloud Optimized GeoTIFF (COG) format, along with SLD and QML style files.
-
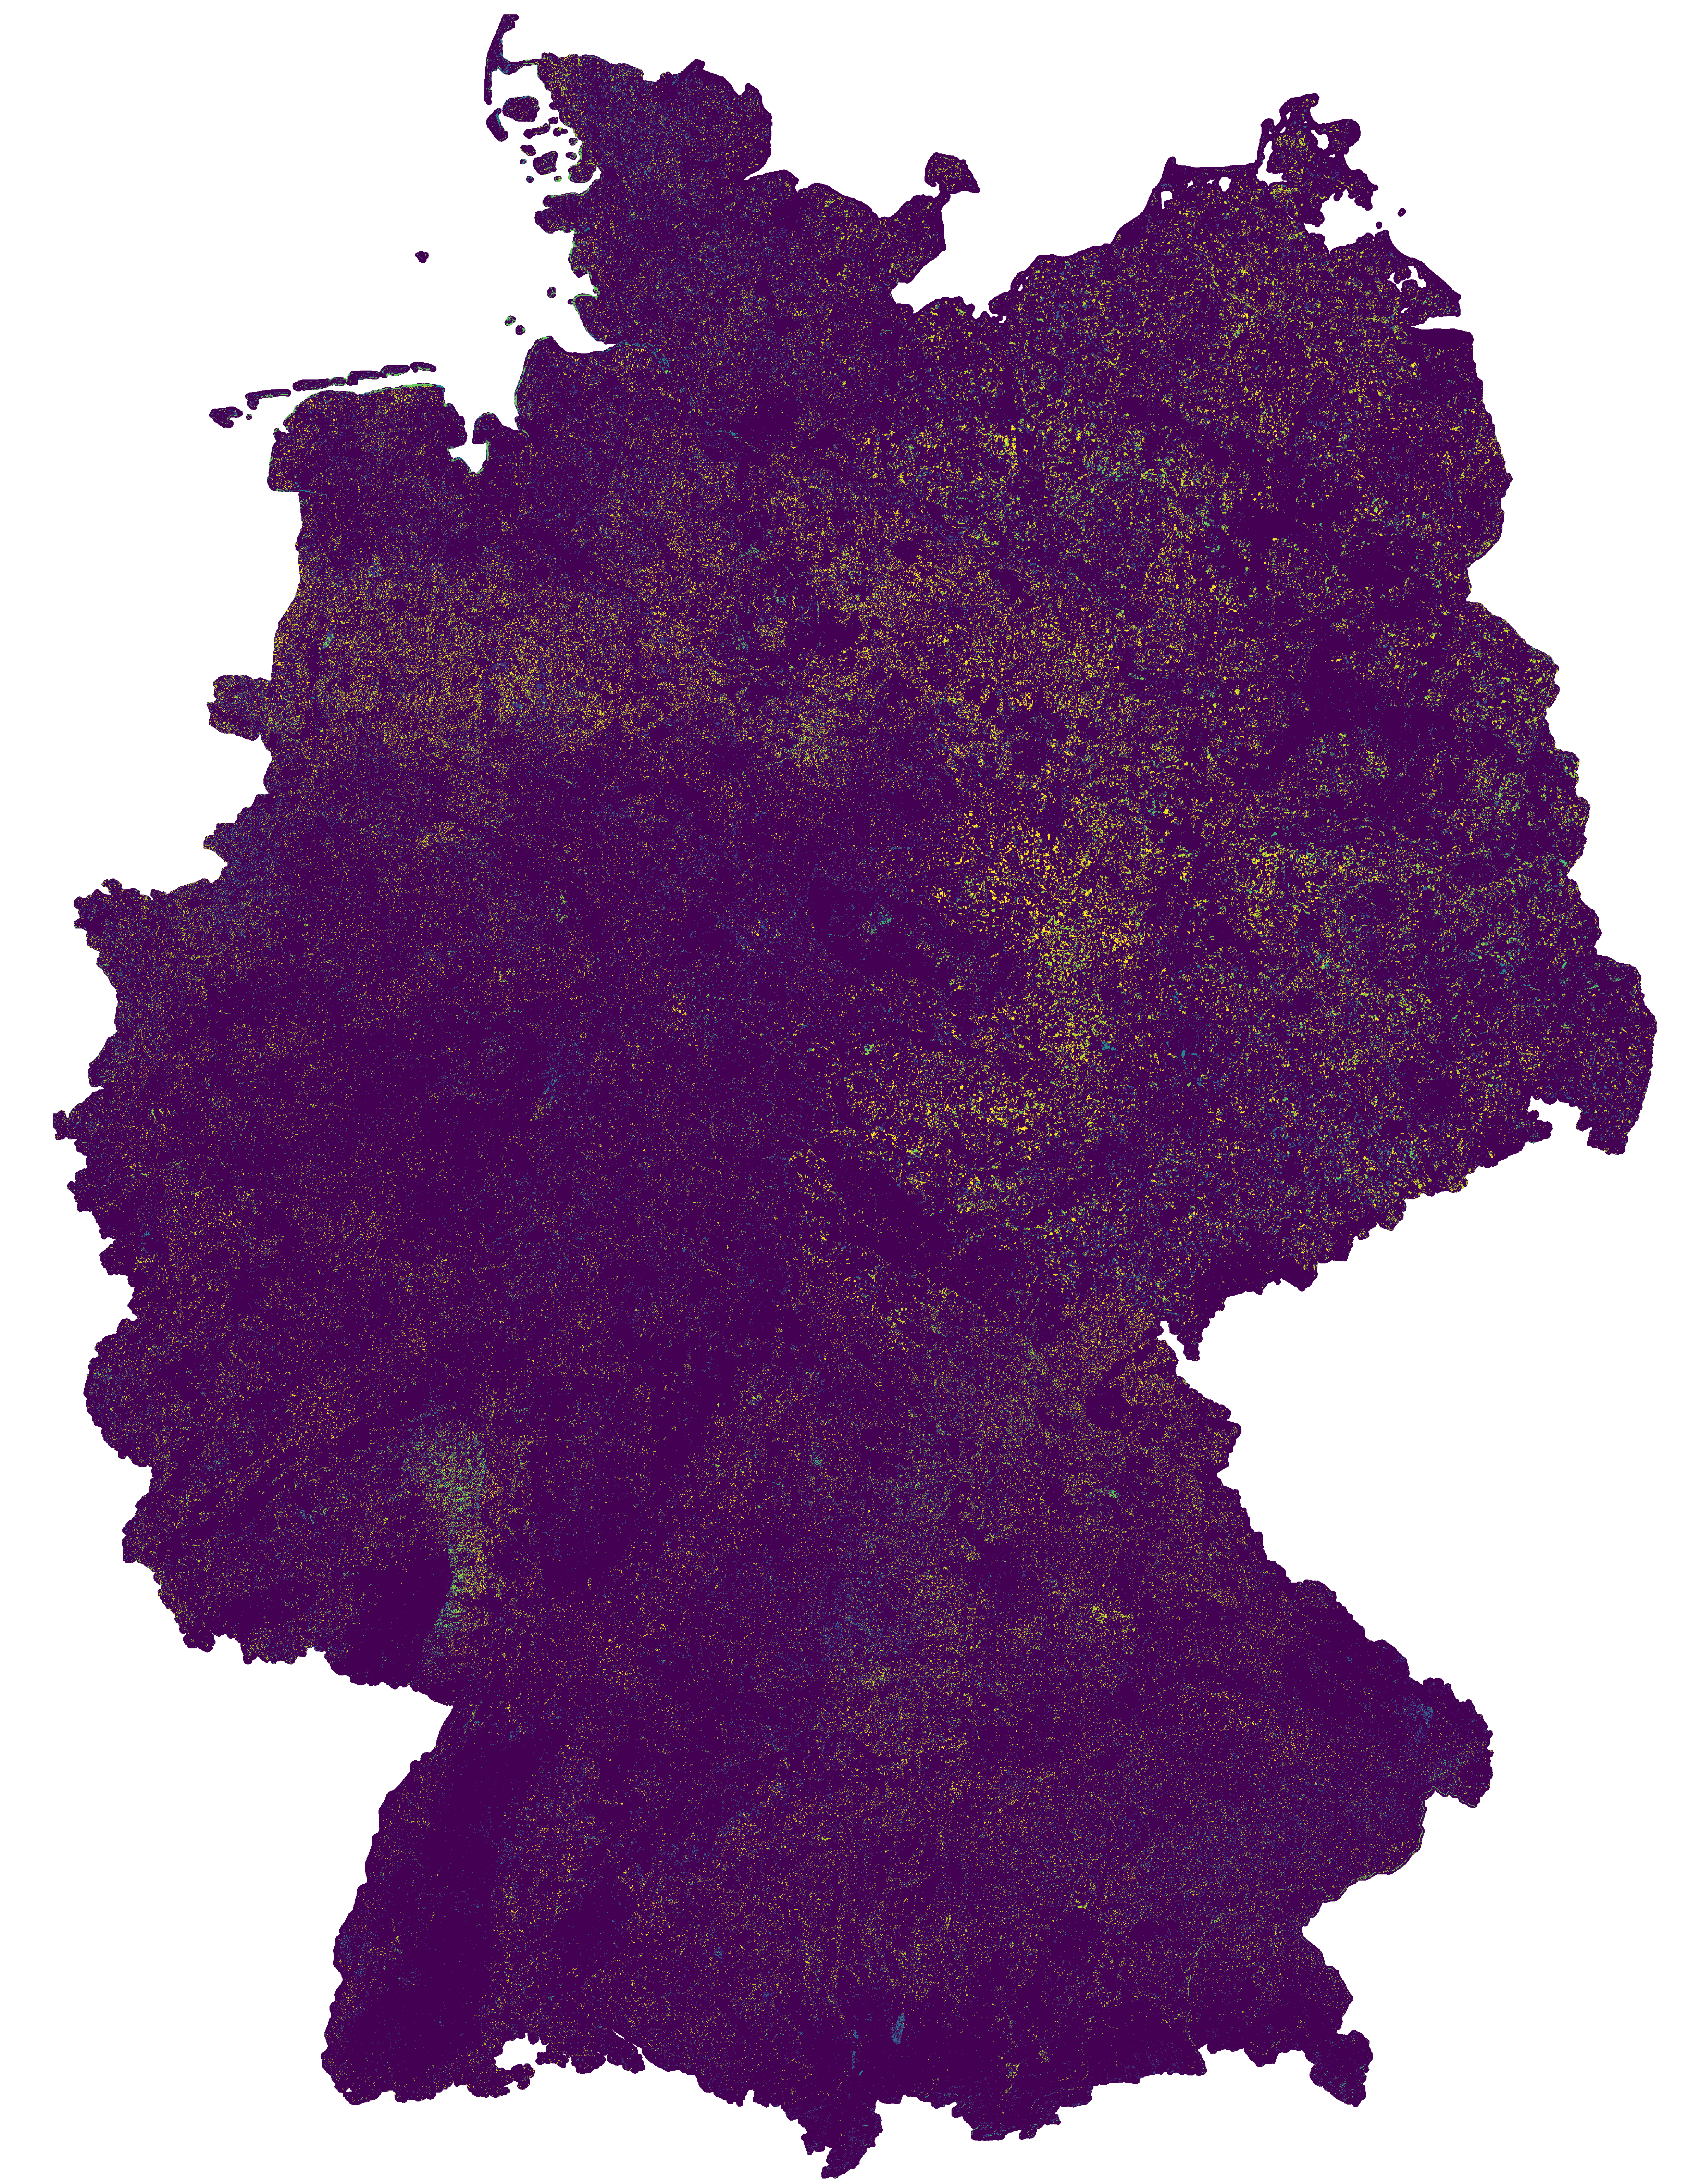
This change map was produced as an intermediate result in the course of the project incora (Inwertsetzung von Copernicus-Daten für die Raumbeobachtung, mFUND Förderkennzeichen: 19F2079C) in cooperation with ILS (Institut für Landes- und Stadtentwicklungsforschung gGmbH) and BBSR (Bundesinstitut für Bau-, Stadt- und Raumforschung) funded by BMVI (Federal Ministry of Transport and Digital Infrastructure). The goal of incora is an analysis of settlement and infrastructure dynamics in Germany based on Copernicus Sentinel data. The map indicates land cover changes between the years 2016 and 2019. It is a difference map from two classifications based on Sentinel-2 MAJA data (MAJA L3A-WASP: https://geoservice.dlr.de/web/maps/sentinel2:l3a:wasp; DLR (2019): Sentinel-2 MSI - Level 2A (MAJA-Tiles)- Germany). More information on the two basis classifications can be found here: https://data.mundialis.de/geonetwork/srv/eng/catalog.search#/metadata/db130a09-fc2e-421d-95e2-1575e7c4b45c https://data.mundialis.de/geonetwork/srv/eng/catalog.search#/metadata/36512b46-f3aa-4aa4-8281-7584ec46c813 To keep only significant changes in the change detection map, the following postprocessing steps are applied to the initial difference raster: - Modefilter (3x3) to eliminate isolated pixels and edge effects - Information gain in a 4x4 window compares class distribution within the window from the two timesteps. High values indicate that the class distribution in the window has changed, and thus a change is likely. Gain ranges from 0 to 1, all changes < 0.5 are omitted. - Change areas < 1ha are removed The resulting map has the following nomenclature: 0: No Change 1: Change from low vegetation to forest 2: Change from water to forest 3: Change from built-up to forest 4: Change from bare soil to forest 5: Change from agriculture to forest 6: Change from forest to low vegetation 7: Change from water to low vegetation 8: Change from built-up to low vegetation 9: Change from bare soil to low vegetation 10: Change from agriculture to low vegetation 11: Change from forest to water 12: Change from low vegetation to water 13: Change from built-up to water 14: Change from bare soil to water 15: Change from agriculture to water 16: Change from forest to built-up 17: Change from low vegetation to built-up 18: Change from water to built-up 19: Change from bare soil to built-up 20: Change from agriculture to built-up 21: Change from forest to bare soil 22: Change from low vegetation to bare soil 23: Change from water to bare soil 24: Change from built-up to bare soil 25: Change from agriculture to bare soil 26: Change from forest to agriculture 27: Change from low vegetation to agriculture 28: Change from water to agriculture 29: Change from built-up to agriculture 30: Change from bare soil to agriculture - Contains modified Copernicus Sentinel data (2016/2019), processed by mundialis Incora report with details on methods and results: pending
-

This landcover map was produced with a classification method developed in the project incora (Inwertsetzung von Copernicus-Daten für die Raumbeobachtung, mFUND Förderkennzeichen: 19F2079C) in cooperation with ILS (Institut für Landes- und Stadtentwicklungsforschung gGmbH) and BBSR (Bundesinstitut für Bau-, Stadt- und Raumforschung) funded by BMVI (Federal Ministry of Transport and Digital Infrastructure). The goal of incora is an analysis of settlement and infrastructure dynamics in Germany based on Copernicus Sentinel data. This classification is based on a time-series of monthly averaged, atmospherically corrected Sentinel-2 tiles (MAJA L3A-WASP: https://geoservice.dlr.de/web/maps/sentinel2:l3a:wasp; DLR (2019): Sentinel-2 MSI - Level 2A (MAJA-Tiles)- Germany). It consists of the following landcover classes: 10: forest 20: low vegetation 30: water 40: built-up 50: bare soil 60: agriculture Potential training and validation areas were automatically extracted using spectral indices and their temporal variability from the Sentinel-2 data itself as well as the following auxiliary datasets: - OpenStreetMap (Map data copyrighted OpenStreetMap contributors and available from htttps://www.openstreetmap.org) - Copernicus HRL Imperviousness Status Map 2018 (© European Union, Copernicus Land Monitoring Service 2018, European Environment Agency (EEA)) - S2GLC Land Cover Map of Europe 2017 (Malinowski et al. 2020: Automated Production of Land Cover/Use Map of Europe Based on Sentinel-2 Imagery. Remote Sens. 2020, 12(21), 3523; https://doi.org/10.3390/rs12213523) - Germany NUTS administrative areas 1:250000 (© GeoBasis-DE / BKG 2020 / dl-de/by-2-0 / https://gdz.bkg.bund.de/index.php/default/nuts-gebiete-1-250-000-stand-31-12-nuts250-31-12.html) - Contains modified Copernicus Sentinel data (2020), processed by mundialis Processing was performed for blocks of federal states and individual maps were mosaicked afterwards. For each class 100,000 pixels from the potential training areas were extracted as training data. An exemplary validation of the classification results was perfomed for the federal state of North Rhine-Westphalia as its open data policy allows for direct access to official data to be used as reference. Rules to convert relevant ATKIS Basis-DLM object classes to the incora nomenclature were defined. Subsequently, 5.000 reference points were randomly sampled and their classification in each case visually examined and, if necessary, revised to obtain a robust reference data set. The comparison of this reference data set with the incora classification yielded the following results: overall accuracy: 88.4% class: user's accuracy / producer's accuracy (number of reference points n) forest: 95.0% / 93.8% (1410) low vegetation: 73.4% / 86.5% (844) water: 98.5% / 92.8% (69) built-up: 98.9% / 95.8% (983) bare soil: 23.9% / 82.9% (41) agriculture: 94.6% / 83.2% (1653) Incora report with details on methods and results: pending
-

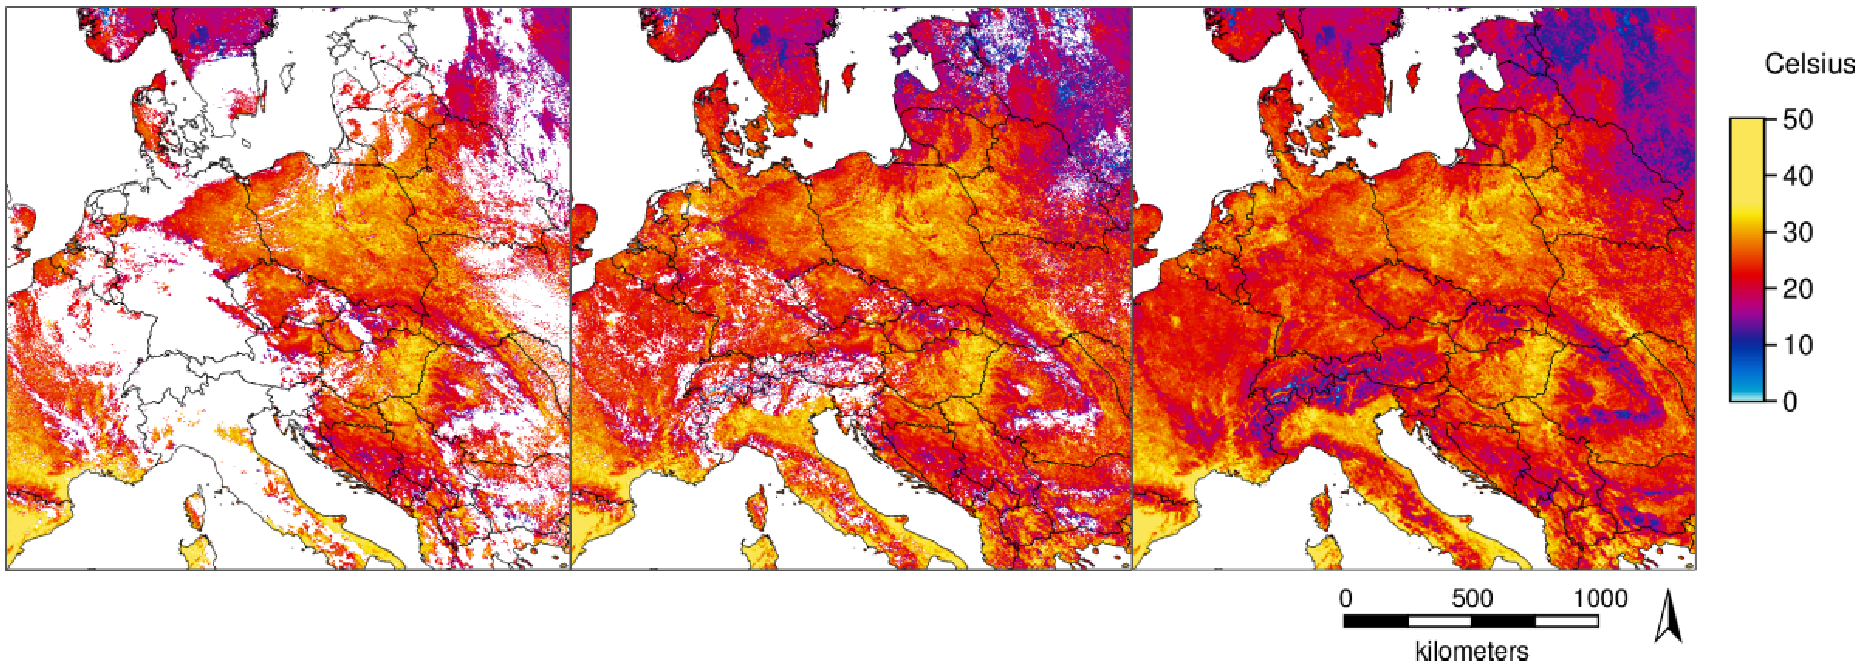
Temperature time series with high spatial and temporal resolutions are important for several applications. The new MODIS Land Surface Temperature (LST) collection 6 provides numerous improvements compared to collection 5. However, being remotely sensed data in the thermal range, LST shows gaps in cloud-covered areas. With a novel method [1] we fully reconstructed the daily global MODIS LST products MOD11C1 and MYD11C1 (spatial resolution: 3 arc-min, i.e. approximately 5.6 km at the equator). For this, we combined temporal and spatial interpolation, using emissivity and elevation as covariates for the spatial interpolation. Here we provide a time series of these reconstructed LST data aggregated as monthly average, minimum and maximum LST maps. [1] Metz M., Andreo V., Neteler M. (2017): A new fully gap-free time series of Land Surface Temperature from MODIS LST data. Remote Sensing, 9(12):1333. DOI: http://dx.doi.org/10.3390/rs9121333 The data available here for download are the reconstructed global MODIS LST products MOD11C1/MYD11C1 at a spatial resolution of 3 arc-min (approximately 5.6 km at the equator; see https://lpdaac.usgs.gov/dataset_discovery/modis/modis_products_table), aggregated to monthly data. The data are provided in GeoTIFF format. The Coordinate Reference System (CRS) is identical to the MOD11C1/MYD11C1 product as provided by NASA. In WKT as reported by GDAL: GEOGCS["Unknown datum based upon the Clarke 1866 ellipsoid", DATUM["Not specified (based on Clarke 1866 spheroid)", SPHEROID["Clarke 1866",6378206.4,294.9786982138982, AUTHORITY["EPSG","7008"]]], PRIMEM["Greenwich",0], UNIT["degree",0.0174532925199433]] Acknowledgments: We are grateful to the NASA Land Processes Distributed Active Archive Center (LP DAAC) for making the MODIS LST data available. The dataset is based on MODIS Collection V006. File name abbreviations: avg = average of daily averages min = minimum of daily minima max = maximum of daily maxima Meaning of pixel values: The pixel values are coded in degree Celsius * 100 (hence, to obtain °C divide the pixel values by 100.0).
-
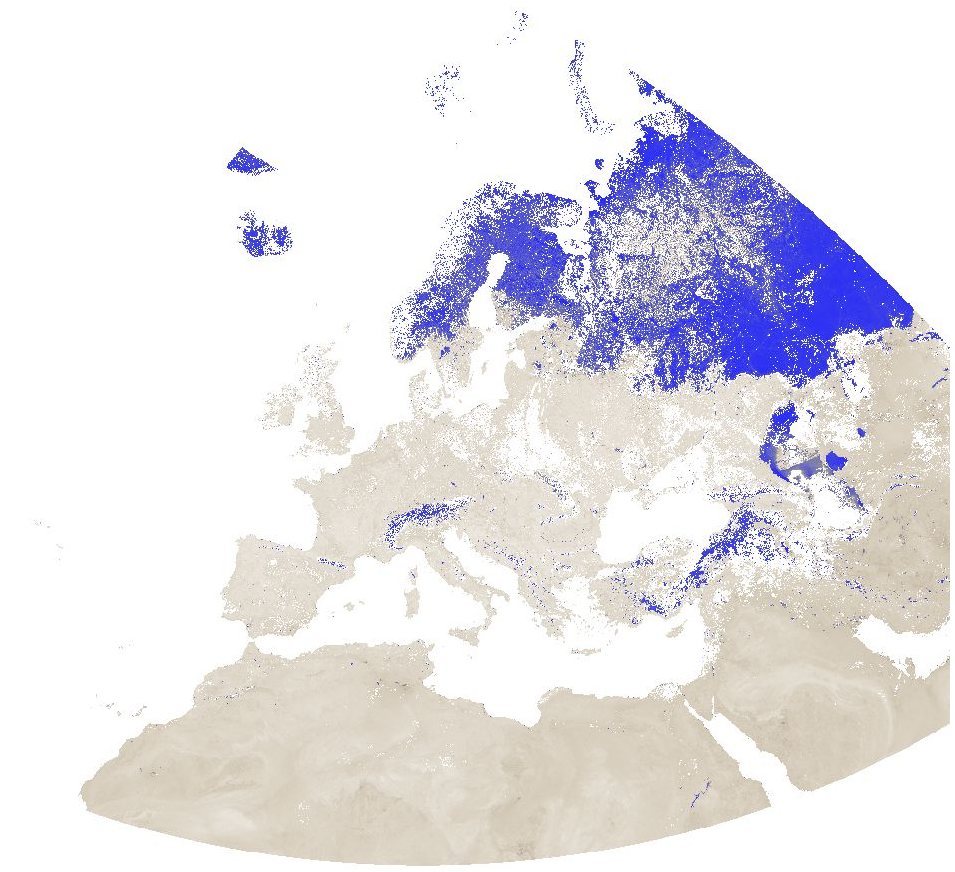
Modified Normalized Difference Water Index (MNDWI) from MODIS data for Europe at 1 km resolution. Source data: - MODIS/Terra Surface Reflectance 8-Day L3 Global 500 m SIN Grid (MOD09A1 v006): https://lpdaac.usgs.gov/products/mod09a1v006/ The corresponding MODIS/Aqua product (MYD09A1 v006) could not be used due to the fact that the Aqua satellite has a number of broken detectors resulting in unreliable data for band 6 (SWIR) measurements. The Moderate Resolution Imaging Spectroradiometer (MODIS) Terra MOD09A1 Version 6 product provides an estimate of the surface spectral reflectance of Terra MODIS Bands 1 through 7 corrected for atmospheric conditions such as gasses, aerosols, and Rayleigh scattering. Along with the seven 500 meter (m) reflectance bands are two quality layers and four observation bands. For each pixel, a value is selected from all the acquisitions within the 8-day composite period. The criteria for the pixel choice include cloud and solar zenith. When several acquisitions meet the criteria the pixel with the minimum channel 3 (blue) value is used. For the time periods October 2016 - March 2017 and August 2020 - April 2021, the original data has been reprojected to ETRS89-extended / LAEA Europe and aggregated to a 1 km grid. The temporal resolution is 8 days. Bad quality pixels (cloud, cloud shadow, dead detector, solar zenith angle too large, etc.) have been masked using the provided quality assurance (QA) layers and appear as "no data". File naming: productCode.acquisitionDate[A (YYYYDDD)]_mosaic_spatialResolution_frequency_VI.tif example: MOD09A1.A2016353_mosaic_1000m_8_days_MNDWI.tif The date is Year and Day of Year. Values are MNDWI * 10000. Example: Value -5099 = -0.5099
-
Temperature time series with high spatial and temporal resolutions are important for several applications. The new MODIS Land Surface Temperature (LST) collection 6 provides numerous improvements compared to collection 5. However, being remotely sensed data in the thermal range, LST shows gaps in cloud-covered areas. With a novel method [1] we fully reconstructed the daily global MODIS LST products MOD11A1/MYD11A1 (spatial resolution: 1 km). For this, we combined temporal and spatial interpolation, using emissivity and elevation as covariates for the spatial interpolation. The data are provided in GeoTIFF format. The Coordinate Reference System (CRS) is identical to the MOD11A1/MYD11A1 product (Sinusoidal) as provided by NASA. In WKT as reported by GDAL: PROJCRS["unnamed", BASEGEOGCRS["Unknown datum based upon the custom spheroid", DATUM["Not specified (based on custom spheroid)", ELLIPSOID["Custom spheroid",6371007.181,0, LENGTHUNIT["metre",1, ID["EPSG",9001]]]], PRIMEM["Greenwich",0, ANGLEUNIT["degree",0.0174532925199433, ID["EPSG",9122]]]], CONVERSION["unnamed", METHOD["Sinusoidal"], PARAMETER["Longitude of natural origin",0, ANGLEUNIT["degree",0.0174532925199433], ID["EPSG",8802]], PARAMETER["False easting",0, LENGTHUNIT["Meter",1], ID["EPSG",8806]], PARAMETER["False northing",0, LENGTHUNIT["Meter",1], ID["EPSG",8807]]], CS[Cartesian,2], AXIS["easting",east, ORDER[1], LENGTHUNIT["Meter",1]], AXIS["northing",north, ORDER[2], LENGTHUNIT["Meter",1]]] Acknowledgments: We are grateful to the NASA Land Processes Distributed Active Archive Center (LP DAAC) for making the MODIS LST data available. The dataset is based on MODIS Collection V006. Meaning of pixel values: The pixel values are coded in Kelvin * 50 Data type: raster, UInt16 Spatial resolution: 926.62543314 m Spatial extent Sinusoidal (W, S, E, N): 0, 4447802.079066, 2223901.039533, 6671703.118599 Spatial extent in EPSG:4326 (W, S, E, N): 0, 40, 40, 60 [1] Metz M., Andreo V., Neteler M. (2017): A new fully gap-free time series of Land Surface Temperature from MODIS LST data. Remote Sensing, 9(12):1333. DOI: http://dx.doi.org/10.3390/rs9121333
-

Northern Italy Land Surface Temperature 1km daily Celsius gap-filled datasetLST daily avg, 2010 - 2018, reconstructed format: GRASS GIS raster format ZLIB compressed stored as a GRASS GIS 7 location/mapset Projection: EU LAEA (EPSG:3035)Reference: Metz, M.; Andreo, V.; Neteler, M. A New Fully Gap-Free Time Series of Land Surface Temperature from MODIS LST Data. Remote Sens. 2017, 9, 1333. https://doi.org/10.3390/rs9121333
-
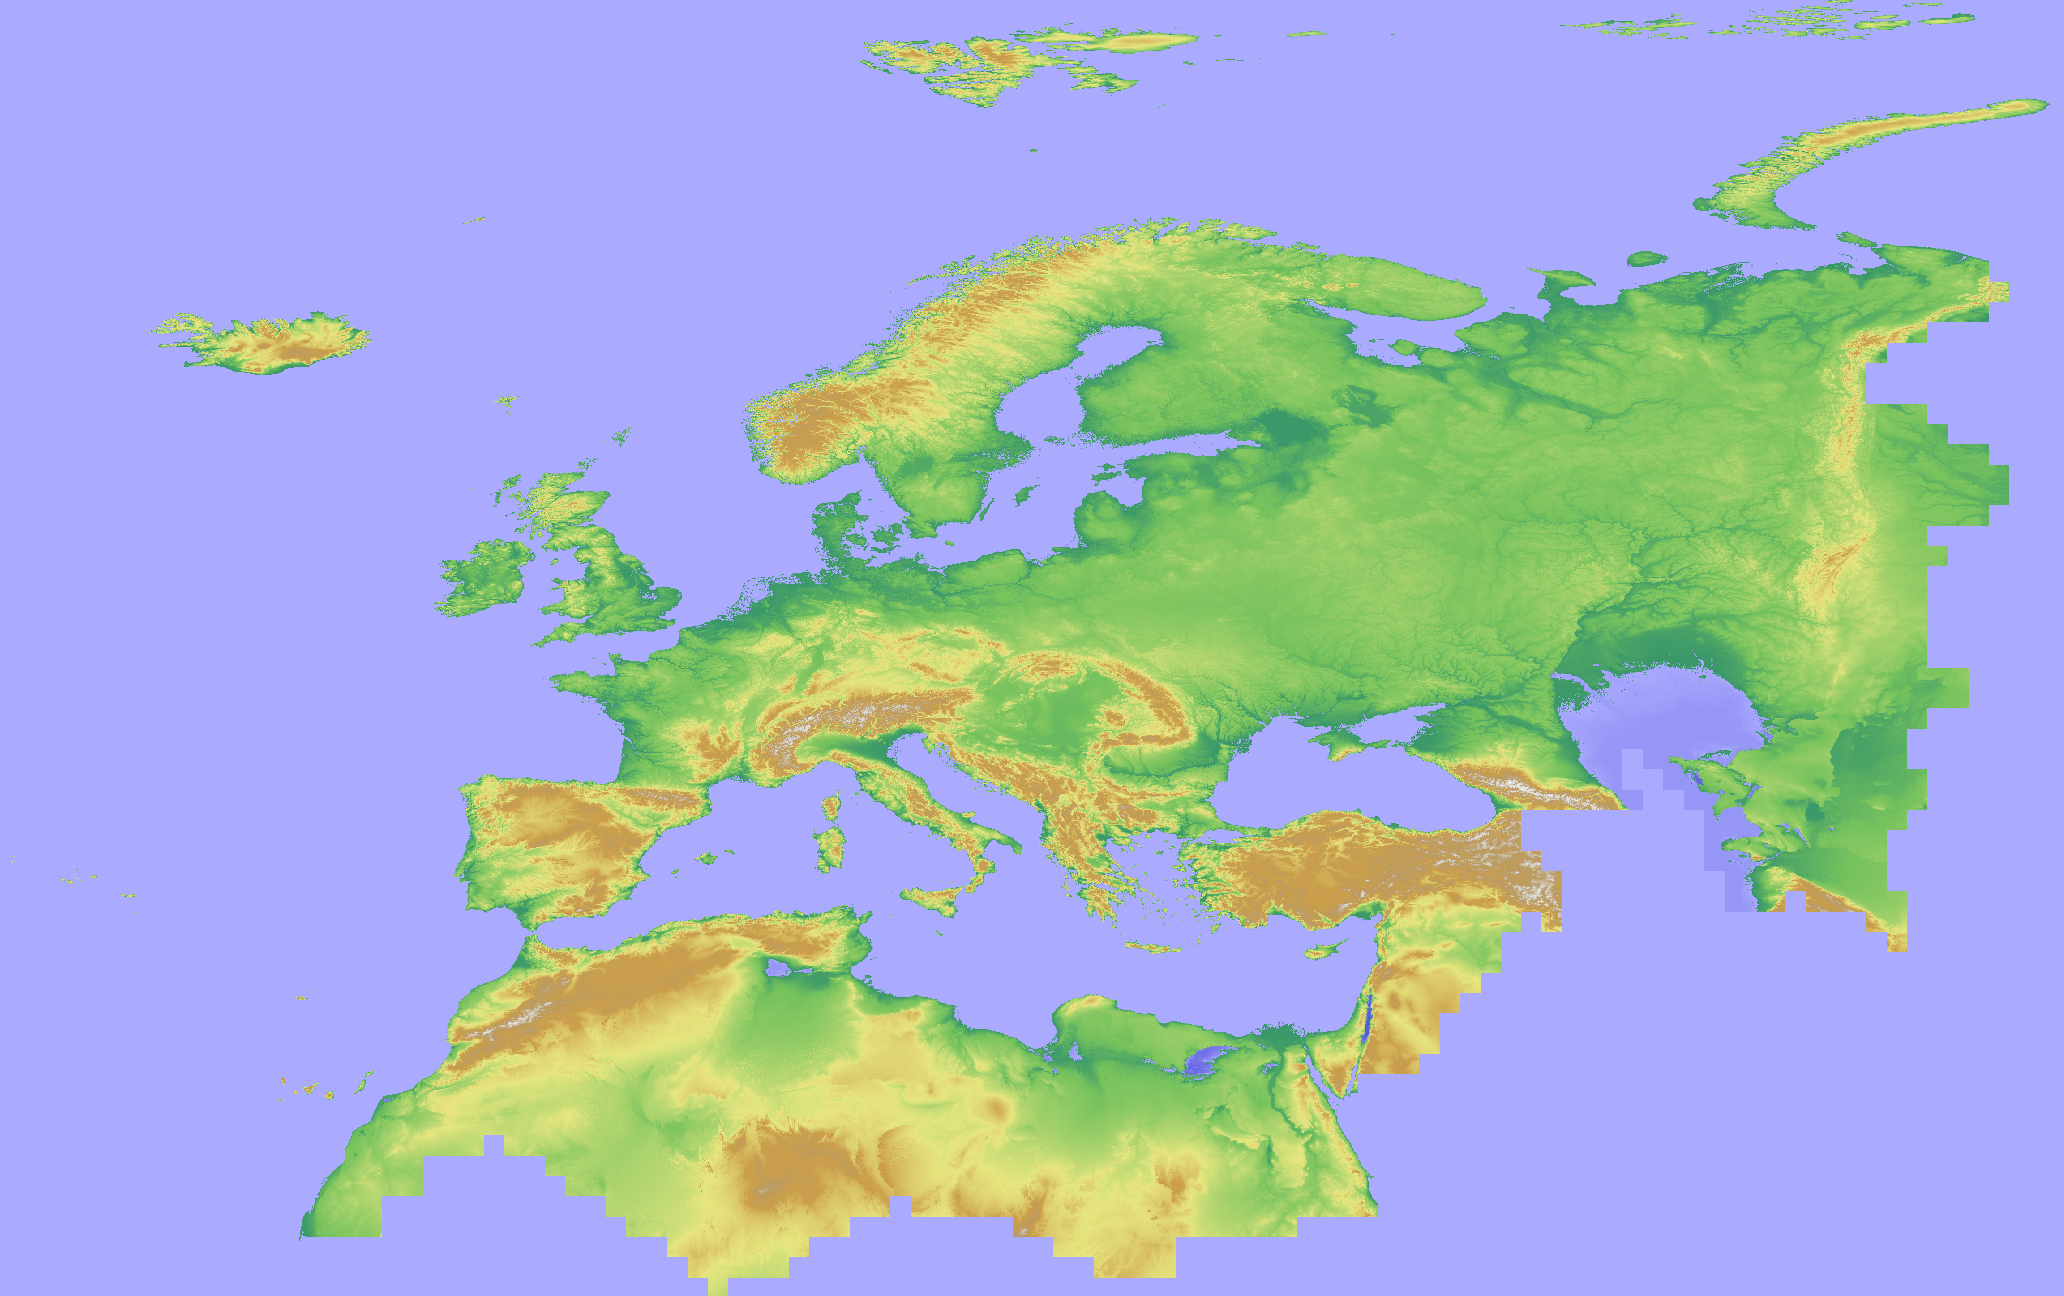
Here we provide a mosaic of the Copernicus DEM 30m for Europe and the corresponding hillshade derived from the GLO-30 public instance of the Copernicus DEM. The CRS is the same as the original Copernicus DEM CRS: EPSG:4326. Note that GLO-30 Public provides limited coverage at 30 meters because a small subset of tiles covering specific countries are not yet released to the public by the Copernicus Programme. Note that ocean areas do not have tiles, there one can assume height values equal to zero. Data is provided as Cloud Optimized GeoTIFFs. The Copernicus DEM is a Digital Surface Model (DSM) which represents the surface of the Earth including buildings, infrastructure and vegetation. The original GLO-30 provides worldwide coverage at 30 meters (refers to 10 arc seconds). Note that ocean areas do not have tiles, there one can assume height values equal to zero. Data is provided as Cloud Optimized GeoTIFFs. Note that the vertical unit for measurement of elevation height is meters. The Copernicus DEM for Europe at 30 m in COG format has been derived from the Copernicus DEM GLO-30, mirrored on Open Data on AWS, dataset managed by Sinergise (https://registry.opendata.aws/copernicus-dem/). Processing steps: The original Copernicus GLO-30 DEM contains a relevant percentage of tiles with non-square pixels. We created a mosaic map in https://gdal.org/drivers/raster/vrt.html format and defined within the VRT file the rule to apply cubic resampling while reading the data, i.e. importing them into GRASS GIS for further processing. We chose cubic instead of bilinear resampling since the height-width ratio of non-square pixels is up to 1:5. Hence, artefacts between adjacent tiles in rugged terrain could be minimized: gdalbuildvrt -input_file_list list_geotiffs_MOOD.csv -r cubic -tr 0.000277777777777778 0.000277777777777778 Copernicus_DSM_30m_MOOD.vrt The pixel values were scaled with 1000 (storing the pixels as integer values) for data volume reduction. In addition, a hillshade raster map was derived from the resampled elevation map (using r.relief, GRASS GIS). Eventually, we exported the elevation and hillshade raster maps in Cloud Optimized GeoTIFF (COG) format, along with SLD and QML style files.