 mundialis GeoNetwork catalogue
climatologyMeteorologyAtmosphere
Type of resources
Available actions
Topics
INSPIRE themes
Keywords
Contact for the resource
Provided by
Formats
Representation types
Update frequencies
status
Scale
Resolution
-
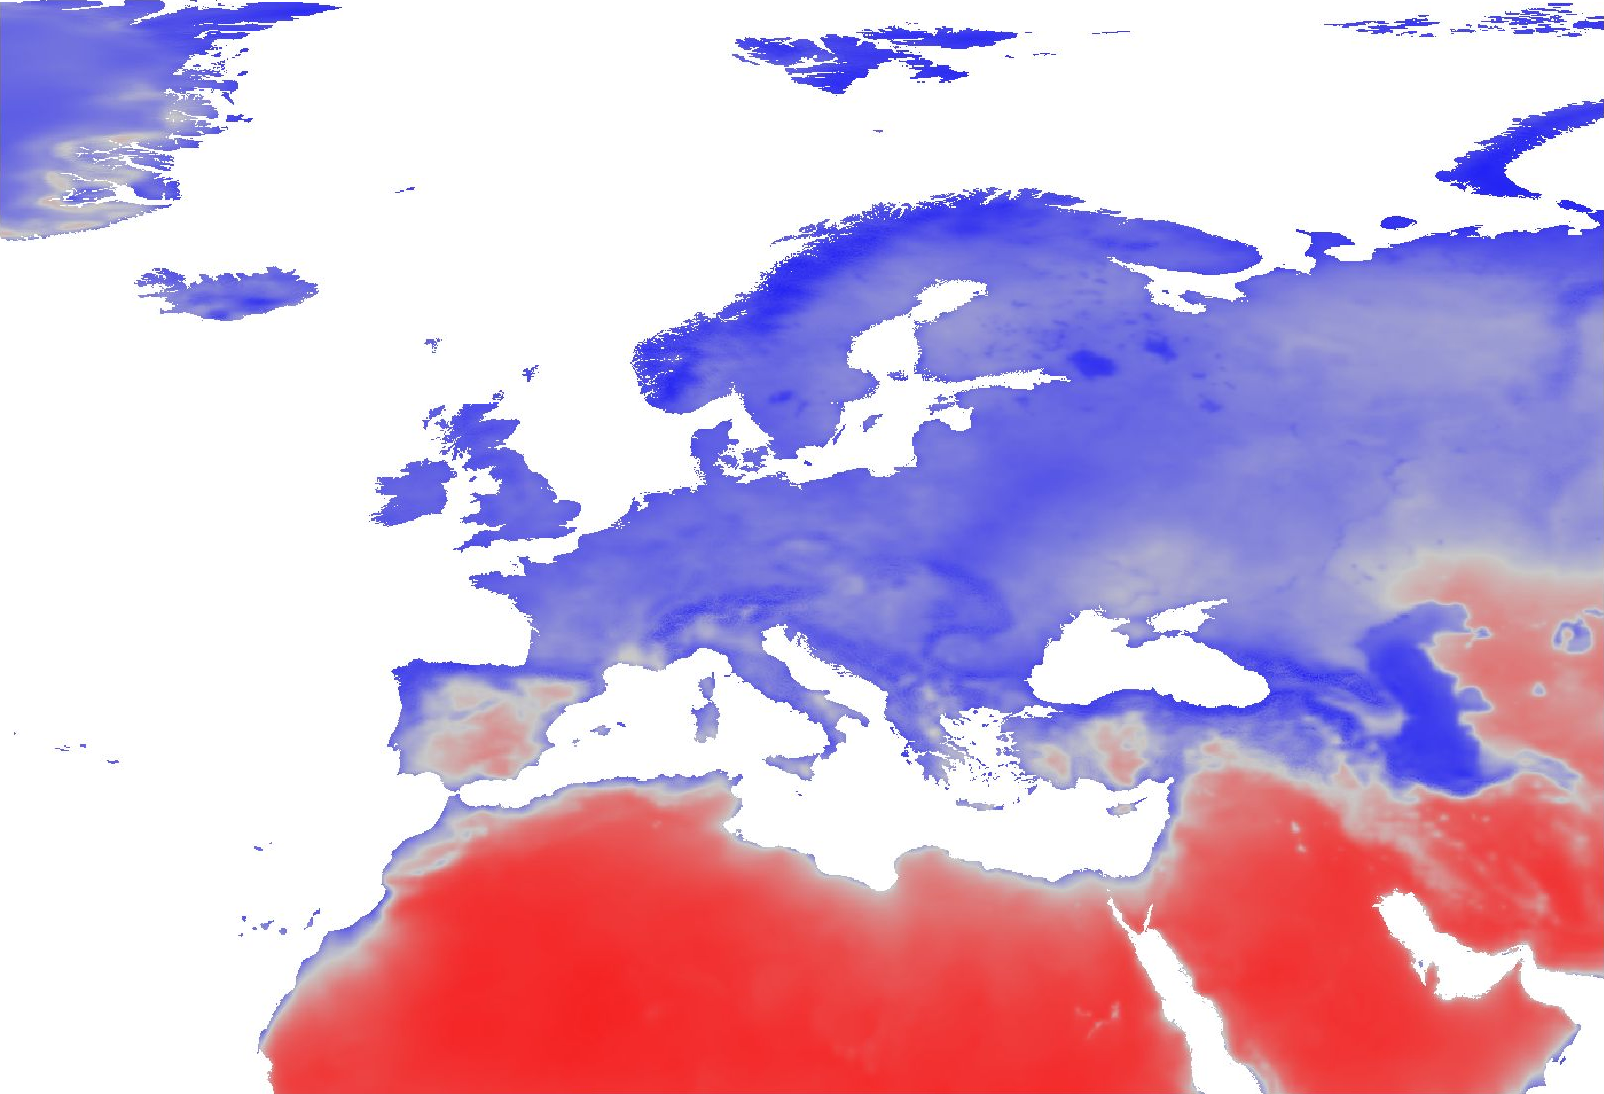
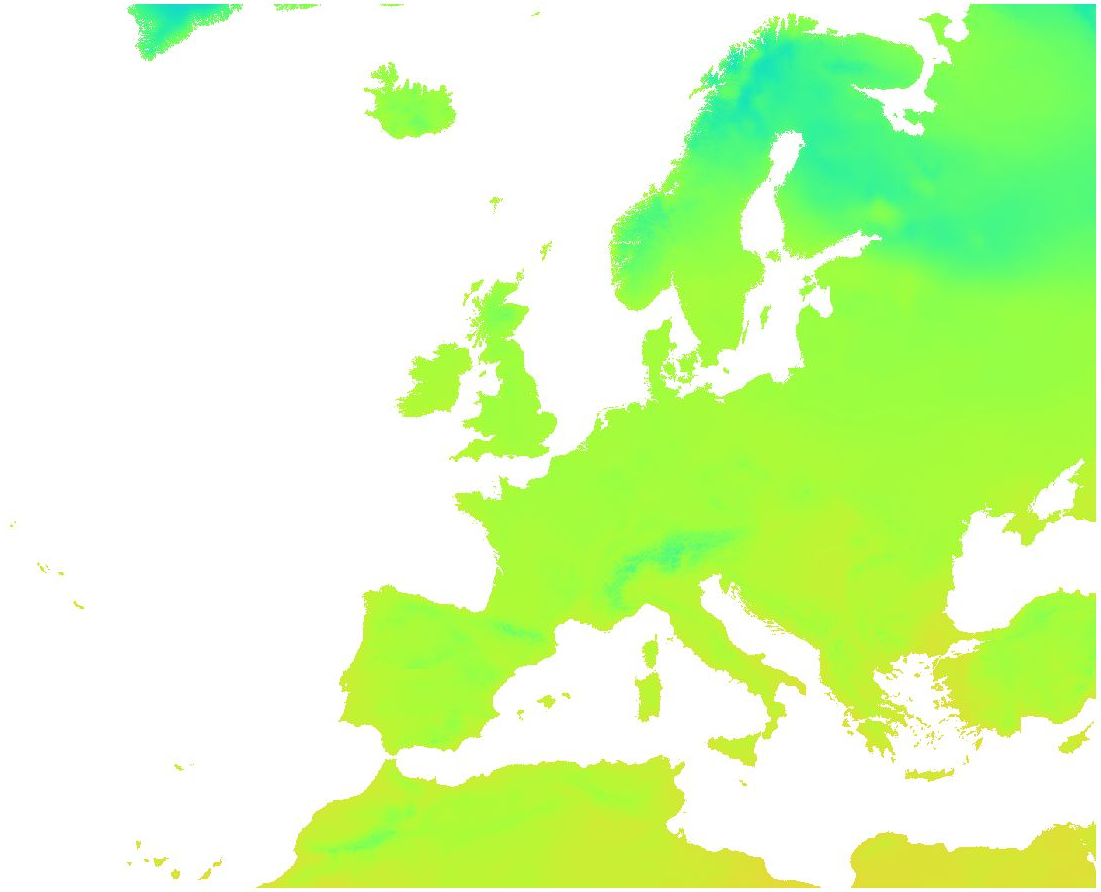
Overview: ERA5-Land is a reanalysis dataset providing a consistent view of the evolution of land variables over several decades at an enhanced resolution compared to ERA5. ERA5-Land has been produced by replaying the land component of the ECMWF ERA5 climate reanalysis. Reanalysis combines model data with observations from across the world into a globally complete and consistent dataset using the laws of physics. Reanalysis produces data that goes several decades back in time, providing an accurate description of the climate of the past. Processing steps: The original hourly ERA5-Land air temperature 2 m above ground and dewpoint temperature 2 m data has been spatially enhanced from 0.1 degree to 30 arc seconds (approx. 1000 m) spatial resolution by image fusion with CHELSA data (V1.2) (https://chelsa-climate.org/). For each day we used the corresponding monthly long-term average of CHELSA. The aim was to use the fine spatial detail of CHELSA and at the same time preserve the general regional pattern and fine temporal detail of ERA5-Land. The steps included aggregation and enhancement, specifically: 1. spatially aggregate CHELSA to the resolution of ERA5-Land 2. calculate difference of ERA5-Land - aggregated CHELSA 3. interpolate differences with a Gaussian filter to 30 arc seconds. 4. add the interpolated differences to CHELSA Subsequently, the temperature time series have been aggregated on a daily basis. From these, daily relative humidity has been calculated for the time period 01/2000 - 07/2021. Relative humidity (rh2m) has been calculated from air temperature 2 m above ground (Ta) and dewpoint temperature 2 m above ground (Td) using the formula for saturated water pressure from Wright (1997): maximum water pressure = 611.21 * exp(17.502 * Ta / (240.97 + Ta)) actual water pressure = 611.21 * exp(17.502 * Td / (240.97 + Td)) relative humidity = actual water pressure / maximum water pressure The resulting relative humidity has been aggregated to decadal averages. Each month is divided into three decades: the first decade of a month covers days 1-10, the second decade covers days 11-20, and the third decade covers days 21-last day of the month. Resultant values have been converted to represent percent * 10, thus covering a theoretical range of [0, 1000]. File naming scheme (YYYY = year; MM = month; dD = number of decade): ERA5_land_rh2m_avg_decadal_YYYY_MM_dD.tif Projection + EPSG code: Latitude-Longitude/WGS84 (EPSG: 4326) Spatial extent: north: 82:00:30N south: 18N west: 32:00:30W east: 70E Spatial resolution: 30 arc seconds (approx. 1000 m) Temporal resolution: Decadal Pixel values: Percent * 10 (scaled to Integer; example: value 738 = 73.8 %) Software used: GDAL 3.2.2 and GRASS GIS 8.0.0 Original ERA5-Land dataset license: https://apps.ecmwf.int/datasets/licences/copernicus/ CHELSA climatologies (V1.2): Data used: Karger D.N., Conrad, O., Böhner, J., Kawohl, T., Kreft, H., Soria-Auza, R.W., Zimmermann, N.E, Linder, H.P., Kessler, M. (2018): Data from: Climatologies at high resolution for the earth's land surface areas. Dryad digital repository. http://dx.doi.org/doi:10.5061/dryad.kd1d4 Original peer-reviewed publication: Karger, D.N., Conrad, O., Böhner, J., Kawohl, T., Kreft, H., Soria-Auza, R.W., Zimmermann, N.E., Linder, P., Kessler, M. (2017): Climatologies at high resolution for the Earth land surface areas. Scientific Data. 4 170122. https://doi.org/10.1038/sdata.2017.122 Processed by: mundialis GmbH & Co. KG, Germany (https://www.mundialis.de/) Reference: Wright, J.M. (1997): Federal meteorological handbook no. 3 (FCM-H3-1997). Office of Federal Coordinator for Meteorological Services and Supporting Research. Washington, DC Acknowledgements: This study was partially funded by EU grant 874850 MOOD. The contents of this publication are the sole responsibility of the authors and don't necessarily reflect the views of the European Commission.
-
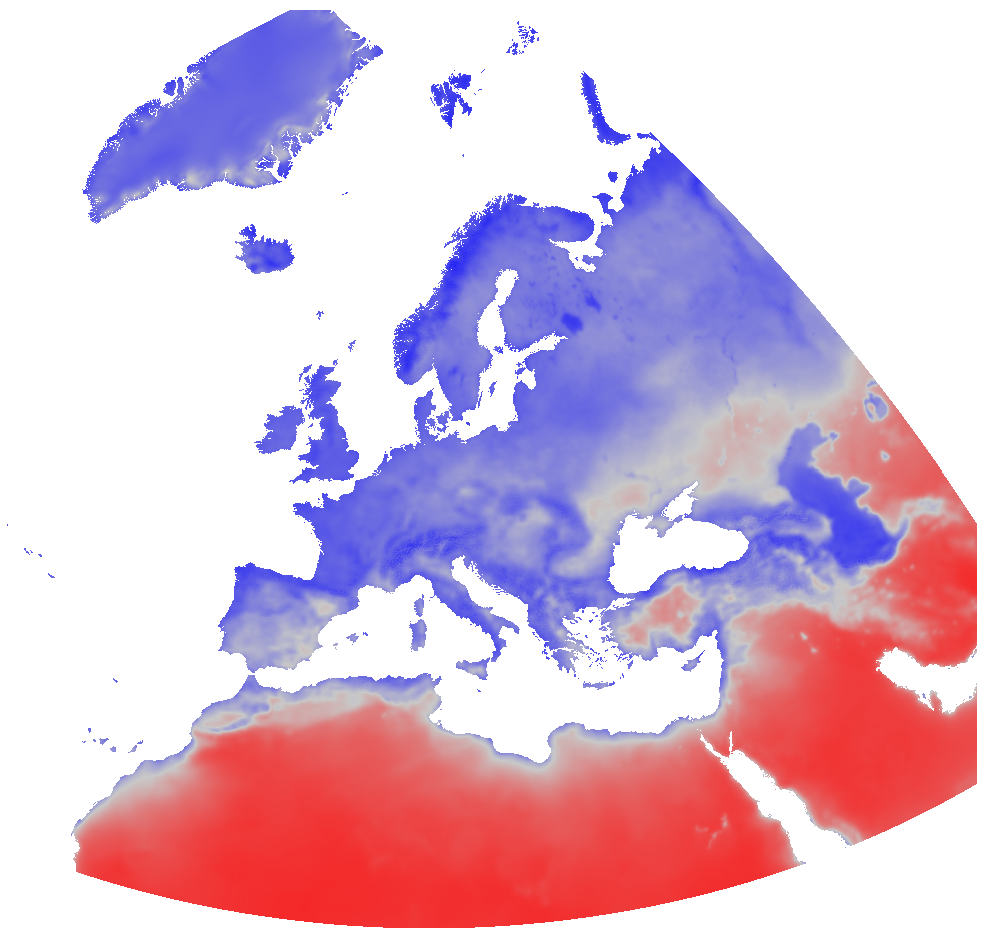
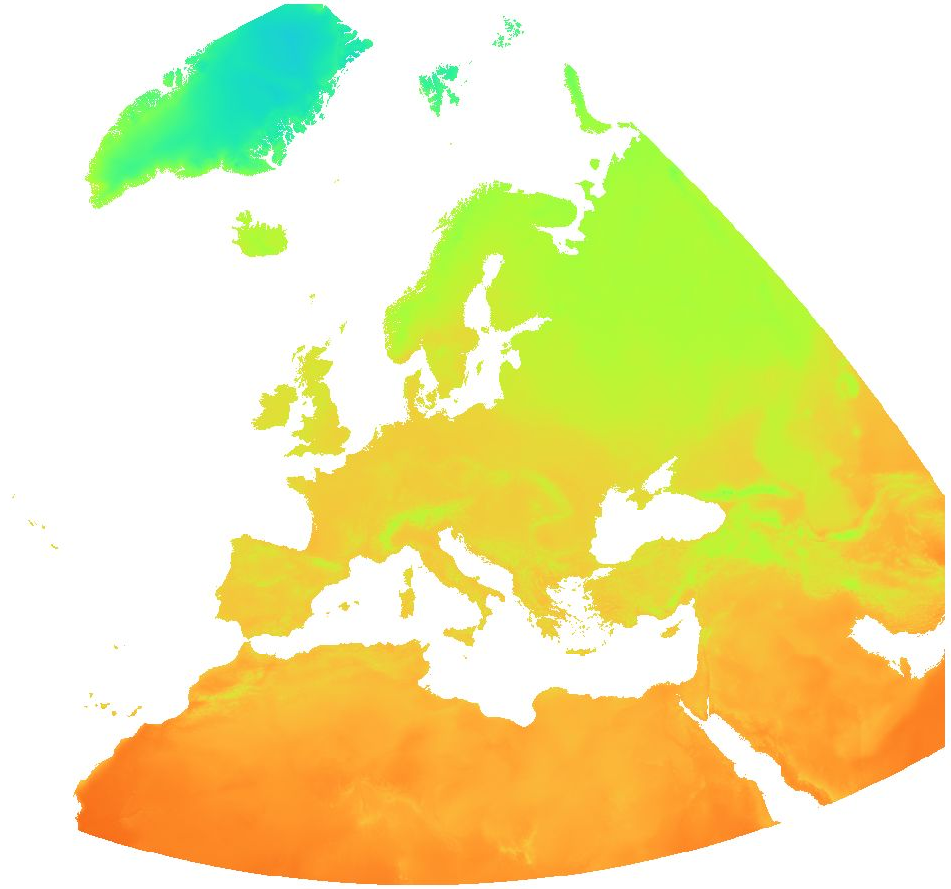
Overview: ERA5-Land is a reanalysis dataset providing a consistent view of the evolution of land variables over several decades at an enhanced resolution compared to ERA5. ERA5-Land has been produced by replaying the land component of the ECMWF ERA5 climate reanalysis. Reanalysis combines model data with observations from across the world into a globally complete and consistent dataset using the laws of physics. Reanalysis produces data that goes several decades back in time, providing an accurate description of the climate of the past. Processing steps: The original hourly ERA5-Land air temperature 2 m above ground and dewpoint temperature 2 m data has been spatially enhanced from 0.1 degree to 30 arc seconds (approx. 1000 m) spatial resolution by image fusion with CHELSA data (V1.2) (https://chelsa-climate.org/). For each day we used the corresponding monthly long-term average of CHELSA. The aim was to use the fine spatial detail of CHELSA and at the same time preserve the general regional pattern and fine temporal detail of ERA5-Land. The steps included aggregation and enhancement, specifically: 1. spatially aggregate CHELSA to the resolution of ERA5-Land 2. calculate difference of ERA5-Land - aggregated CHELSA 3. interpolate differences with a Gaussian filter to 30 arc seconds. 4. add the interpolated differences to CHELSA Subsequently, the temperature time series have been aggregated on a daily basis. From these, daily relative humidity has been calculated for the time period 01/2000 - 12/2023. Relative humidity (rh2m) has been calculated from air temperature 2 m above ground (Ta) and dewpoint temperature 2 m above ground (Td) using the formula for saturated water pressure from Wright (1997): maximum water pressure = 611.21 * exp(17.502 * Ta / (240.97 + Ta)) actual water pressure = 611.21 * exp(17.502 * Td / (240.97 + Td)) relative humidity = actual water pressure / maximum water pressure The resulting relative humidity has been aggregated to monthly averages. Resultant values have been converted to represent percent * 10, thus covering a theoretical range of [0, 1000]. The data have been reprojected to EU LAEA. File naming scheme (YYYY = year; MM = month): ERA5_land_rh2m_avg_monthly_YYYY_MM.tif Projection + EPSG code: EU LAEA (EPSG: 3035) Spatial extent: north: 6874000 south: -485000 west: 869000 east: 8712000 Spatial resolution: 1000 m Temporal resolution: Monthly Pixel values: Percent * 10 (scaled to Integer; example: value 738 = 73.8 %) Software used: GDAL 3.2.2 and GRASS GIS 8.0.0/8.3.2 Original ERA5-Land dataset license: https://apps.ecmwf.int/datasets/licences/copernicus/ CHELSA climatologies (V1.2): Data used: Karger D.N., Conrad, O., Böhner, J., Kawohl, T., Kreft, H., Soria-Auza, R.W., Zimmermann, N.E, Linder, H.P., Kessler, M. (2018): Data from: Climatologies at high resolution for the earth's land surface areas. Dryad digital repository. http://dx.doi.org/doi:10.5061/dryad.kd1d4 Original peer-reviewed publication: Karger, D.N., Conrad, O., Böhner, J., Kawohl, T., Kreft, H., Soria-Auza, R.W., Zimmermann, N.E., Linder, P., Kessler, M. (2017): Climatologies at high resolution for the Earth land surface areas. Scientific Data. 4 170122. https://doi.org/10.1038/sdata.2017.122 Processed by: mundialis GmbH & Co. KG, Germany (https://www.mundialis.de/) Reference: Wright, J.M. (1997): Federal meteorological handbook no. 3 (FCM-H3-1997). Office of Federal Coordinator for Meteorological Services and Supporting Research. Washington, DC Data is also available in Latitude-Longitude/WGS84 (EPSG: 4326) projection: https://data.mundialis.de/geonetwork/srv/eng/catalog.search#/metadata/b9ce7dba-4130-428d-96f0-9089d8b9f4a5 Acknowledgements: This study was partially funded by EU grant 874850 MOOD. The contents of this publication are the sole responsibility of the authors and don't necessarily reflect the views of the European Commission.
-

Overview: ERA5-Land is a reanalysis dataset providing a consistent view of the evolution of land variables over several decades at an enhanced resolution compared to ERA5. ERA5-Land has been produced by replaying the land component of the ECMWF ERA5 climate reanalysis. Reanalysis combines model data with observations from across the world into a globally complete and consistent dataset using the laws of physics. Reanalysis produces data that goes several decades back in time, providing an accurate description of the climate of the past. Processing steps: The original hourly ERA5-Land air temperature 2 m above ground and dewpoint temperature 2 m data has been spatially enhanced from 0.1 degree to 30 arc seconds (approx. 1000 m) spatial resolution by image fusion with CHELSA data (V1.2) (https://chelsa-climate.org/). For each day we used the corresponding monthly long-term average of CHELSA. The aim was to use the fine spatial detail of CHELSA and at the same time preserve the general regional pattern and fine temporal detail of ERA5-Land. The steps included aggregation and enhancement, specifically: 1. spatially aggregate CHELSA to the resolution of ERA5-Land 2. calculate difference of ERA5-Land - aggregated CHELSA 3. interpolate differences with a Gaussian filter to 30 arc seconds. 4. add the interpolated differences to CHELSA Subsequently, the temperature time series have been aggregated on a daily basis. From these, daily relative humidity has been calculated for the time period 01/2000 - 07/2021. Relative humidity (rh2m) has been calculated from air temperature 2 m above ground (Ta) and dewpoint temperature 2 m above ground (Td) using the formula for saturated water pressure from Wright (1997): maximum water pressure = 611.21 * exp(17.502 * Ta / (240.97 + Ta)) actual water pressure = 611.21 * exp(17.502 * Td / (240.97 + Td)) relative humidity = actual water pressure / maximum water pressure Data provided is the daily averages of relative humidity. Resultant values have been converted to represent percent * 10, thus covering a theoretical range of [0, 1000]. The data have been reprojected to EU LAEA. File naming scheme (YYYY = year; MM = month; DD = day): ERA5_land_rh2m_avg_daily_YYYYMMDD.tif Projection + EPSG code: EU LAEA (EPSG: 3035) Spatial extent: north: 6874000 south: -485000 west: 869000 east: 8712000 Spatial resolution: 1000 m Temporal resolution: Daily Pixel values: Percent * 10 (scaled to Integer; example: value 738 = 73.8 %) Software used: GDAL 3.2.2 and GRASS GIS 8.0.0 Original ERA5-Land dataset license: https://apps.ecmwf.int/datasets/licences/copernicus/ CHELSA climatologies (V1.2): Data used: Karger D.N., Conrad, O., Böhner, J., Kawohl, T., Kreft, H., Soria-Auza, R.W., Zimmermann, N.E, Linder, H.P., Kessler, M. (2018): Data from: Climatologies at high resolution for the earth's land surface areas. Dryad digital repository. http://dx.doi.org/doi:10.5061/dryad.kd1d4 Original peer-reviewed publication: Karger, D.N., Conrad, O., Böhner, J., Kawohl, T., Kreft, H., Soria-Auza, R.W., Zimmermann, N.E., Linder, P., Kessler, M. (2017): Climatologies at high resolution for the Earth land surface areas. Scientific Data. 4 170122. https://doi.org/10.1038/sdata.2017.122 Processed by: mundialis GmbH & Co. KG, Germany (https://www.mundialis.de/) Reference: Wright, J.M. (1997): Federal meteorological handbook no. 3 (FCM-H3-1997). Office of Federal Coordinator for Meteorological Services and Supporting Research. Washington, DC Acknowledgements: This study was partially funded by EU grant 874850 MOOD. The contents of this publication are the sole responsibility of the authors and don't necessarily reflect the views of the European Commission.
-

Overview: ERA5-Land is a reanalysis dataset providing a consistent view of the evolution of land variables over several decades at an enhanced resolution compared to ERA5. ERA5-Land has been produced by replaying the land component of the ECMWF ERA5 climate reanalysis. Reanalysis combines model data with observations from across the world into a globally complete and consistent dataset using the laws of physics. Reanalysis produces data that goes several decades back in time, providing an accurate description of the climate of the past. Processing steps: The original hourly ERA5-Land air temperature 2 m above ground and dewpoint temperature 2 m data has been spatially enhanced from 0.1 degree to 30 arc seconds (approx. 1000 m) spatial resolution by image fusion with CHELSA data (V1.2) (https://chelsa-climate.org/). For each day we used the corresponding monthly long-term average of CHELSA. The aim was to use the fine spatial detail of CHELSA and at the same time preserve the general regional pattern and fine temporal detail of ERA5-Land. The steps included aggregation and enhancement, specifically: 1. spatially aggregate CHELSA to the resolution of ERA5-Land 2. calculate difference of ERA5-Land - aggregated CHELSA 3. interpolate differences with a Gaussian filter to 30 arc seconds. 4. add the interpolated differences to CHELSA Subsequently, the temperature time series have been aggregated on a daily basis. From these, daily relative humidity has been calculated for the time period 01/2000 - 07/2021. Relative humidity (rh2m) has been calculated from air temperature 2 m above ground (Ta) and dewpoint temperature 2 m above ground (Td) using the formula for saturated water pressure from Wright (1997): maximum water pressure = 611.21 * exp(17.502 * Ta / (240.97 + Ta)) actual water pressure = 611.21 * exp(17.502 * Td / (240.97 + Td)) relative humidity = actual water pressure / maximum water pressure The resulting relative humidity has been aggregated to decadal averages. Each month is divided into three decades: the first decade of a month covers days 1-10, the second decade covers days 11-20, and the third decade covers days 21-last day of the month. Resultant values have been converted to represent percent * 10, thus covering a theoretical range of [0, 1000]. The data have been reprojected to EU LAEA. File naming scheme (YYYY = year; MM = month; dD = number of decade): ERA5_land_rh2m_avg_decadal_YYYY_MM_dD.tif Projection + EPSG code: EU LAEA (EPSG: 3035) Spatial extent: north: 6874000 south: -485000 west: 869000 east: 8712000 Spatial resolution: 1000 m Temporal resolution: Decadal Pixel values: Percent * 10 (scaled to Integer; example: value 738 = 73.8 %) Software used: GDAL 3.2.2 and GRASS GIS 8.0.0 Original ERA5-Land dataset license: https://apps.ecmwf.int/datasets/licences/copernicus/ CHELSA climatologies (V1.2): Data used: Karger D.N., Conrad, O., Böhner, J., Kawohl, T., Kreft, H., Soria-Auza, R.W., Zimmermann, N.E, Linder, H.P., Kessler, M. (2018): Data from: Climatologies at high resolution for the earth's land surface areas. Dryad digital repository. http://dx.doi.org/doi:10.5061/dryad.kd1d4 Original peer-reviewed publication: Karger, D.N., Conrad, O., Böhner, J., Kawohl, T., Kreft, H., Soria-Auza, R.W., Zimmermann, N.E., Linder, P., Kessler, M. (2017): Climatologies at high resolution for the Earth land surface areas. Scientific Data. 4 170122. https://doi.org/10.1038/sdata.2017.122 Processed by: mundialis GmbH & Co. KG, Germany (https://www.mundialis.de/) Reference: Wright, J.M. (1997): Federal meteorological handbook no. 3 (FCM-H3-1997). Office of Federal Coordinator for Meteorological Services and Supporting Research. Washington, DC Acknowledgements: This study was partially funded by EU grant 874850 MOOD. The contents of this publication are the sole responsibility of the authors and don't necessarily reflect the views of the European Commission.
-

Overview: ERA5-Land is a reanalysis dataset providing a consistent view of the evolution of land variables over several decades at an enhanced resolution compared to ERA5. ERA5-Land has been produced by replaying the land component of the ECMWF ERA5 climate reanalysis. Reanalysis combines model data with observations from across the world into a globally complete and consistent dataset using the laws of physics. Reanalysis produces data that goes several decades back in time, providing an accurate description of the climate of the past. Processing steps: The original hourly ERA5-Land air temperature 2 m above ground and dewpoint temperature 2 m data has been spatially enhanced from 0.1 degree to 30 arc seconds (approx. 1000 m) spatial resolution by image fusion with CHELSA data (V1.2) (https://chelsa-climate.org/). For each day we used the corresponding monthly long-term average of CHELSA. The aim was to use the fine spatial detail of CHELSA and at the same time preserve the general regional pattern and fine temporal detail of ERA5-Land. The steps included aggregation and enhancement, specifically: 1. spatially aggregate CHELSA to the resolution of ERA5-Land 2. calculate difference of ERA5-Land - aggregated CHELSA 3. interpolate differences with a Gaussian filter to 30 arc seconds. 4. add the interpolated differences to CHELSA Subsequently, the temperature time series have been aggregated on a daily basis. From these, daily relative humidity has been calculated for the time period 01/2000 - 12/2023. Relative humidity (rh2m) has been calculated from air temperature 2 m above ground (Ta) and dewpoint temperature 2 m above ground (Td) using the formula for saturated water pressure from Wright (1997): maximum water pressure = 611.21 * exp(17.502 * Ta / (240.97 + Ta)) actual water pressure = 611.21 * exp(17.502 * Td / (240.97 + Td)) relative humidity = actual water pressure / maximum water pressure The resulting relative humidity has been aggregated to monthly averages. Resultant values have been converted to represent percent * 10, thus covering a theoretical range of [0, 1000]. File naming scheme (YYYY = year; MM = month): ERA5_land_rh2m_avg_monthly_YYYY_MM.tif Projection + EPSG code: Latitude-Longitude/WGS84 (EPSG: 4326) Spatial extent: north: 82:00:30N south: 18N west: 32:00:30W east: 70E Spatial resolution: 30 arc seconds (approx. 1000 m) Temporal resolution: Monthly Pixel values: Percent * 10 (scaled to Integer; example: value 738 = 73.8 %) Software used: GDAL 3.2.2 and GRASS GIS 8.0.0/8.3.2 Original ERA5-Land dataset license: https://apps.ecmwf.int/datasets/licences/copernicus/ CHELSA climatologies (V1.2): Data used: Karger D.N., Conrad, O., Böhner, J., Kawohl, T., Kreft, H., Soria-Auza, R.W., Zimmermann, N.E, Linder, H.P., Kessler, M. (2018): Data from: Climatologies at high resolution for the earth's land surface areas. Dryad digital repository. http://dx.doi.org/doi:10.5061/dryad.kd1d4 Original peer-reviewed publication: Karger, D.N., Conrad, O., Böhner, J., Kawohl, T., Kreft, H., Soria-Auza, R.W., Zimmermann, N.E., Linder, P., Kessler, M. (2017): Climatologies at high resolution for the Earth land surface areas. Scientific Data. 4 170122. https://doi.org/10.1038/sdata.2017.122 Processed by: mundialis GmbH & Co. KG, Germany (https://www.mundialis.de/) Reference: Wright, J.M. (1997): Federal meteorological handbook no. 3 (FCM-H3-1997). Office of Federal Coordinator for Meteorological Services and Supporting Research. Washington, DC Data is also available in EU LAEA (EPSG: 3035) projection: https://data.mundialis.de/geonetwork/srv/eng/catalog.search#/metadata/ab06ed25-84af-43c9-b1c3-57e3b6ad8d29 Acknowledgements: This study was partially funded by EU grant 874850 MOOD. The contents of this publication are the sole responsibility of the authors and don't necessarily reflect the views of the European Commission.
-

Overview: ERA5-Land is a reanalysis dataset providing a consistent view of the evolution of land variables over several decades at an enhanced resolution compared to ERA5. ERA5-Land has been produced by replaying the land component of the ECMWF ERA5 climate reanalysis. Reanalysis combines model data with observations from across the world into a globally complete and consistent dataset using the laws of physics. Reanalysis produces data that goes several decades back in time, providing an accurate description of the climate of the past. Processing steps: The original hourly ERA5-Land air temperature 2 m above ground and dewpoint temperature 2 m data has been spatially enhanced from 0.1 degree to 30 arc seconds (approx. 1000 m) spatial resolution by image fusion with CHELSA data (V1.2) (https://chelsa-climate.org/). For each day we used the corresponding monthly long-term average of CHELSA. The aim was to use the fine spatial detail of CHELSA and at the same time preserve the general regional pattern and fine temporal detail of ERA5-Land. The steps included aggregation and enhancement, specifically: 1. spatially aggregate CHELSA to the resolution of ERA5-Land 2. calculate difference of ERA5-Land - aggregated CHELSA 3. interpolate differences with a Gaussian filter to 30 arc seconds. 4. add the interpolated differences to CHELSA Subsequently, the temperature time series have been aggregated on a daily basis. From these, daily relative humidity has been calculated for the time period 01/2000 - 07/2021. Relative humidity (rh2m) has been calculated from air temperature 2 m above ground (Ta) and dewpoint temperature 2 m above ground (Td) using the formula for saturated water pressure from Wright (1997): maximum water pressure = 611.21 * exp(17.502 * Ta / (240.97 + Ta)) actual water pressure = 611.21 * exp(17.502 * Td / (240.97 + Td)) relative humidity = actual water pressure / maximum water pressure Data provided is the daily averages of relative humidity. This set provides data for the years 2000 - 2004. For other time periods, please see further linked data sets. Resultant values have been converted to represent percent * 10, thus covering a theoretical range of [0, 1000]. File naming scheme (YYYY = year; MM = month; DD = day): ERA5_land_rh2m_avg_daily_YYYYMMDD.tif Projection + EPSG code: Latitude-Longitude/WGS84 (EPSG: 4326) Spatial extent: north: 82:00:30N south: 18N west: 32:00:30W east: 70E Spatial resolution: 30 arc seconds (approx. 1000 m) Temporal resolution: Daily Pixel values: Percent * 10 (scaled to Integer; example: value 738 = 73.8 %) Software used: GDAL 3.2.2 and GRASS GIS 8.0.0 Original ERA5-Land dataset license: https://apps.ecmwf.int/datasets/licences/copernicus/ CHELSA climatologies (V1.2): Data used: Karger D.N., Conrad, O., Böhner, J., Kawohl, T., Kreft, H., Soria-Auza, R.W., Zimmermann, N.E, Linder, H.P., Kessler, M. (2018): Data from: Climatologies at high resolution for the earth's land surface areas. Dryad digital repository. http://dx.doi.org/doi:10.5061/dryad.kd1d4 Original peer-reviewed publication: Karger, D.N., Conrad, O., Böhner, J., Kawohl, T., Kreft, H., Soria-Auza, R.W., Zimmermann, N.E., Linder, P., Kessler, M. (2017): Climatologies at high resolution for the Earth land surface areas. Scientific Data. 4 170122. https://doi.org/10.1038/sdata.2017.122 Processed by: mundialis GmbH & Co. KG, Germany (https://www.mundialis.de/) Reference: Wright, J.M. (1997): Federal meteorological handbook no. 3 (FCM-H3-1997). Office of Federal Coordinator for Meteorological Services and Supporting Research. Washington, DC Acknowledgements: This study was partially funded by EU grant 874850 MOOD. The contents of this publication are the sole responsibility of the authors and don't necessarily reflect the views of the European Commission.
-
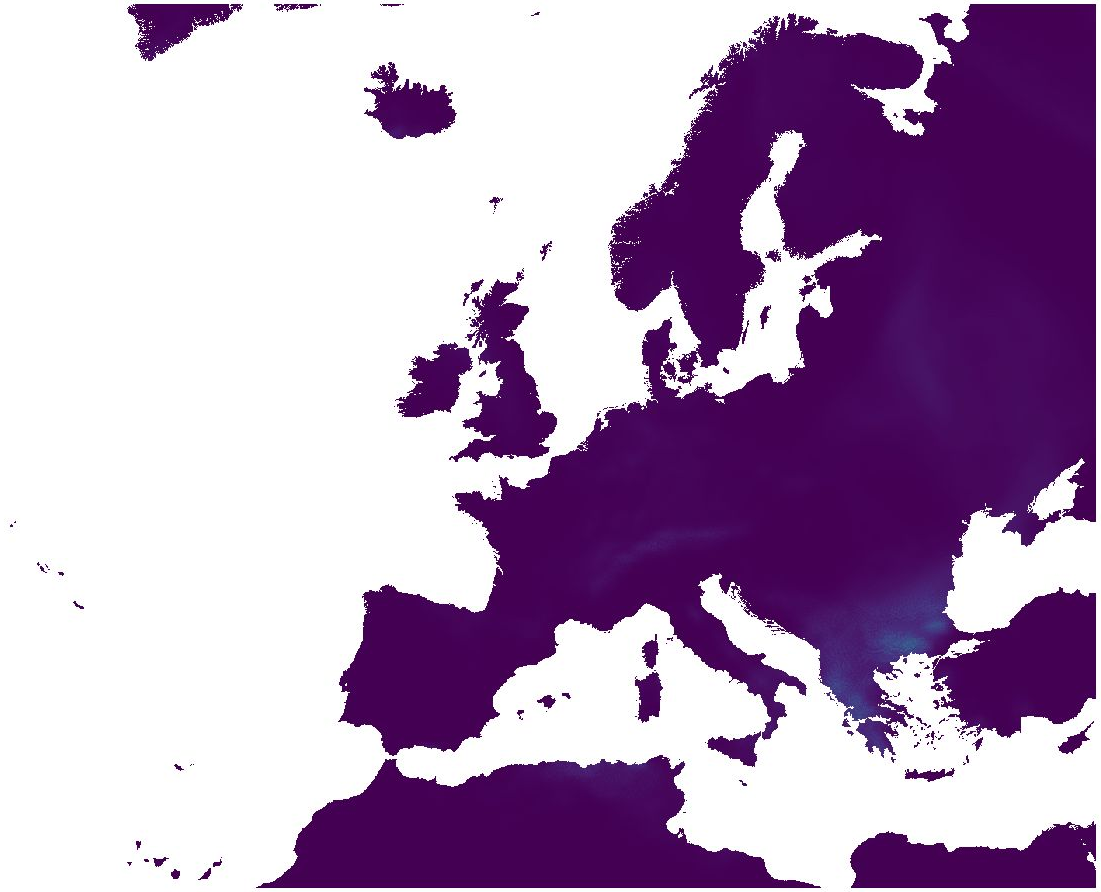
Overview: ERA5-Land is a reanalysis dataset providing a consistent view of the evolution of land variables over several decades at an enhanced resolution compared to ERA5. ERA5-Land has been produced by replaying the land component of the ECMWF ERA5 climate reanalysis. Reanalysis combines model data with observations from across the world into a globally complete and consistent dataset using the laws of physics. Reanalysis produces data that goes several decades back in time, providing an accurate description of the climate of the past. Total precipitation: Accumulated liquid and frozen water, including rain and snow, that falls to the Earth's surface. It is the sum of large-scale precipitation (that precipitation which is generated by large-scale weather patterns, such as troughs and cold fronts) and convective precipitation (generated by convection which occurs when air at lower levels in the atmosphere is warmer and less dense than the air above, so it rises). Precipitation variables do not include fog, dew or the precipitation that evaporates in the atmosphere before it lands at the surface of the Earth. This variable is accumulated from the beginning of the forecast time to the end of the forecast step. The units of precipitation are depth in metres. It is the depth the water would have if it were spread evenly over the grid box. Care should be taken when comparing model variables with observations, because observations are often local to a particular point in space and time, rather than representing averages over a model grid box and model time step. The original ERA5-Land dataset (period: 2000 - 2020) has been reprocessed to: - aggregate ERA5-Land hourly data to daily data (minimum, mean, maximum) - while increasing the resolution from the native ERA5-Land resolution of 0.1 degree (~ 9 km) to 30 arc-sec (~ 1 km) by image fusion with CHELSA data (V1.2) (https://chelsa-climate.org/). For each day we used the corresponding monthly long-term average of CHELSA. The aim was to use the fine spatial detail of CHELSA and at the same time preserve the general regional pattern and fine temporal detail of ERA5-Land. The steps included aggregation and enhancement, specifically: 1. spatially aggregate CHELSA to the resolution of ERA5-Land 2. calculate proportion of ERA5-Land / aggregated CHELSA 3. interpolate proportion with a Gaussian filter to 30 arc seconds 4. multiply the interpolated proportions with CHELSA Using proportions ensures that areas without precipitation remain areas without precipitation. Only if there was actual precipitation in a given area, precipitation was redistributed according to the spatial detail of CHELSA. Data available is the daily sum of precipitation. Software used: GDAL 3.2.2 and GRASS GIS 8.0.0 (r.resamp.stats -w; r.relief) Original ERA5-Land dataset license: https://cds.climate.copernicus.eu/api/v2/terms/static/licence-to-use-copernicus-products.pdf CHELSA climatologies (V1.2): Data used: Karger D.N., Conrad, O., Böhner, J., Kawohl, T., Kreft, H., Soria-Auza, R.W., Zimmermann, N.E, Linder, H.P., Kessler, M. (2018): Data from: Climatologies at high resolution for the earth's land surface areas. Dryad digital repository. http://dx.doi.org/doi:10.5061/dryad.kd1d4 Original peer-reviewed publication: Karger, D.N., Conrad, O., Böhner, J., Kawohl, T., Kreft, H., Soria-Auza, R.W., Zimmermann, N.E., Linder, P., Kessler, M. (2017): Climatologies at high resolution for the Earth land surface areas. Scientific Data. 4 170122. https://doi.org/10.1038/sdata.2017.122
-
Overview: ERA5-Land is a reanalysis dataset providing a consistent view of the evolution of land variables over several decades at an enhanced resolution compared to ERA5. ERA5-Land has been produced by replaying the land component of the ECMWF ERA5 climate reanalysis. Reanalysis combines model data with observations from across the world into a globally complete and consistent dataset using the laws of physics. Reanalysis produces data that goes several decades back in time, providing an accurate description of the climate of the past. Total precipitation: Accumulated liquid and frozen water, including rain and snow, that falls to the Earth's surface. It is the sum of large-scale precipitation (that precipitation which is generated by large-scale weather patterns, such as troughs and cold fronts) and convective precipitation (generated by convection which occurs when air at lower levels in the atmosphere is warmer and less dense than the air above, so it rises). Precipitation variables do not include fog, dew or the precipitation that evaporates in the atmosphere before it lands at the surface of the Earth. This variable is accumulated from the beginning of the forecast time to the end of the forecast step. The units of precipitation are depth in metres. It is the depth the water would have if it were spread evenly over the grid box. Care should be taken when comparing model variables with observations, because observations are often local to a particular point in space and time, rather than representing averages over a model grid box and model time step. Processing steps: The original hourly ERA5-Land data has been spatially enhanced from 0.1 degree to 30 arc seconds (approx. 1000 m) spatial resolution by image fusion with CHELSA data (V1.2) (https://chelsa-climate.org/). For each day we used the corresponding monthly long-term average of CHELSA. The aim was to use the fine spatial detail of CHELSA and at the same time preserve the general regional pattern and fine temporal detail of ERA5-Land. The steps included aggregation and enhancement, specifically: 1. spatially aggregate CHELSA to the resolution of ERA5-Land 2. calculate proportion of ERA5-Land / aggregated CHELSA 3. interpolate proportion with a Gaussian filter to 30 arc seconds 4. multiply the interpolated proportions with CHELSA Using proportions ensures that areas without precipitation remain areas without precipitation. Only if there was actual precipitation in a given area, precipitation was redistributed according to the spatial detail of CHELSA. The spatially enhanced daily ERA5-Land data has been aggregated on a weekly basis starting from Saturday for the time period 2016 - 2020. Data available is the weekly average of daily sums and the weekly sum of daily sums of total precipitation. File naming: Average of daily sum: era5_land_prectot_avg_weekly_YYYY_MM_DD.tif Sum of daily sum: era5_land_prectot_sum_weekly_YYYY_MM_DD.tif The date in the file name determines the start day of the week (Saturday). Pixel values: mm * 10 Example: Value 218 = 21.8 mm Coordinate reference system: ETRS89 / LAEA Europe (EPSG:3035) (EPSG:3035) Spatial extent: north: 82:00:30N south: 18N west: 32:00:30W east: 70E Spatial resolution: 1km Temporal resolution: weekly Period: 01/01/2016 - 12/31/2020 Lineage: Dataset has been processed from original Copernicus Climate Data Store (ERA5-Land) data sources. As auxiliary data CHELSA climate data has been used. Software used: GDAL 3.2.2 and GRASS GIS 8.0.0 (r.resamp.stats -w; r.relief) Original ERA5-Land dataset license: https://cds.climate.copernicus.eu/api/v2/terms/static/licence-to-use-copernicus-products.pdf CHELSA climatologies (V1.2): Data used: Karger D.N., Conrad, O., Böhner, J., Kawohl, T., Kreft, H., Soria-Auza, R.W., Zimmermann, N.E, Linder, H.P., Kessler, M. (2018): Data from: Climatologies at high resolution for the earth's land surface areas. Dryad digital repository. http://dx.doi.org/doi:10.5061/dryad.kd1d4 Original peer-reviewed publication: Karger, D.N., Conrad, O., Böhner, J., Kawohl, T., Kreft, H., Soria-Auza, R.W., Zimmermann, N.E., Linder, P., Kessler, M. (2017): Climatologies at high resolution for the Earth land surface areas. Scientific Data. 4 170122. https://doi.org/10.1038/sdata.2017.122 Other resources: https://data.mundialis.de/geonetwork/srv/eng/catalog.search#/metadata/601ea08c-0768-4af3-a8fa-7da25fb9125b Format: GeoTIFF Representation type: Grid Processed by: mundialis GmbH & Co. KG, Germany (https://www.mundialis.de/) Contact: mundialis GmbH & Co. KG, info@mundialis.de Acknowledgements: This study was partially funded by EU grant 874850 MOOD. The contents of this publication are the sole responsibility of the authors and don't necessarily reflect the views of the European Commission.
-
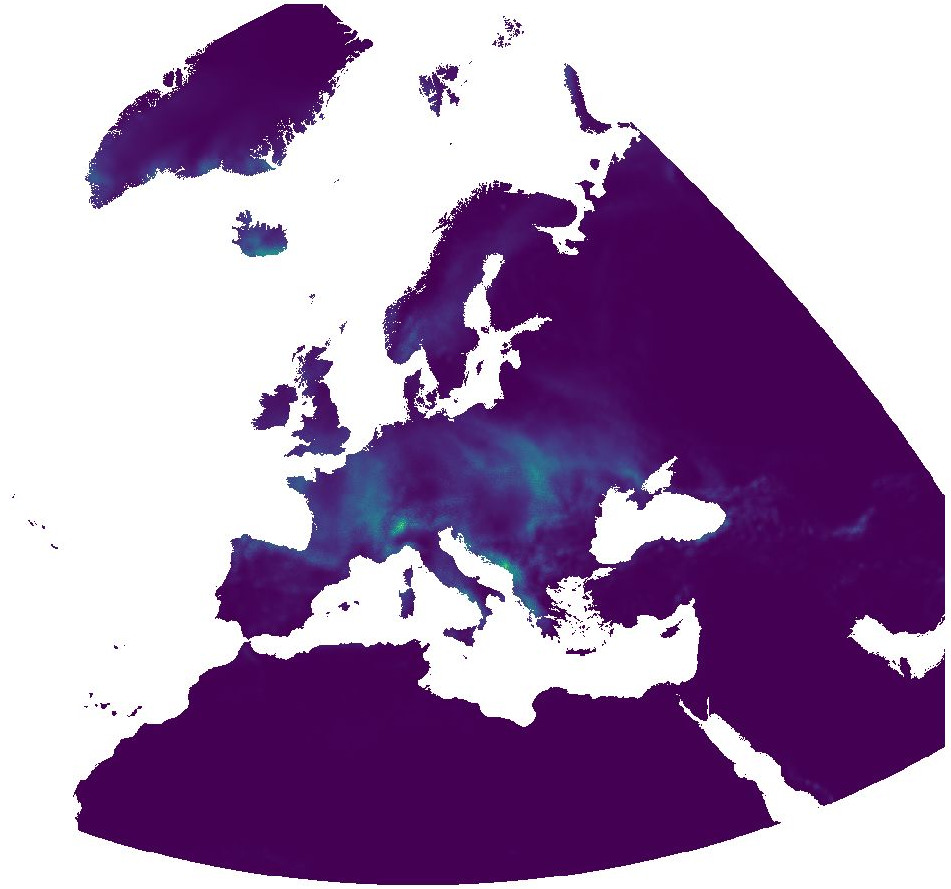
Overview: ERA5-Land is a reanalysis dataset providing a consistent view of the evolution of land variables over several decades at an enhanced resolution compared to ERA5. ERA5-Land has been produced by replaying the land component of the ECMWF ERA5 climate reanalysis. Reanalysis combines model data with observations from across the world into a globally complete and consistent dataset using the laws of physics. Reanalysis produces data that goes several decades back in time, providing an accurate description of the climate of the past. Air temperature (2 m): Temperature of air at 2m above the surface of land, sea or in-land waters. 2m temperature is calculated by interpolating between the lowest model level and the Earth's surface, taking account of the atmospheric conditions. The original ERA5-Land dataset (period: 2000 - 2020) has been reprocessed to: - aggregate ERA5-Land hourly data to daily data (minimum, mean, maximum) - while increasing the spatial resolution from the native ERA5-Land resolution of 0.1 degree (~ 9 km) to 30 arc seconds (~ 1 km) by image fusion with CHELSA data (V1.2) (https://chelsa-climate.org/). For each day we used the corresponding monthly long-term average of CHELSA. The aim was to use the fine spatial detail of CHELSA and at the same time preserve the general regional pattern and fine temporal detail of ERA5-Land. The steps included aggregation and enhancement, specifically: 1. spatially aggregate CHELSA to the resolution of ERA5-Land 2. calculate difference of ERA5-Land - aggregated CHELSA 3. interpolate differences with a Gaussian filter to 30 arc seconds 4. add the interpolated differences to CHELSA Data available is the daily average, minimum and maximum of air temperature (2 m). Spatial resolution: 30 arc seconds (approx. 1000 m) Temporal resolution: Daily Pixel values: °C * 10 (scaled to Integer; example: value 238 = 23.8 %) Software used: GDAL 3.2.2 and GRASS GIS 8.0.0 (r.resamp.stats -w; r.relief) Original ERA5-Land dataset license: https://cds.climate.copernicus.eu/api/v2/terms/static/licence-to-use-copernicus-products.pdf CHELSA climatologies (V1.2): Data used: Karger D.N., Conrad, O., Böhner, J., Kawohl, T., Kreft, H., Soria-Auza, R.W., Zimmermann, N.E, Linder, H.P., Kessler, M. (2018): Data from: Climatologies at high resolution for the earth's land surface areas. Dryad digital repository. http://dx.doi.org/doi:10.5061/dryad.kd1d4 Original peer-reviewed publication: Karger, D.N., Conrad, O., Böhner, J., Kawohl, T., Kreft, H., Soria-Auza, R.W., Zimmermann, N.E., Linder, P., Kessler, M. (2017): Climatologies at high resolution for the Earth land surface areas. Scientific Data. 4 170122. https://doi.org/10.1038/sdata.2017.122
-
Overview: ERA5-Land is a reanalysis dataset providing a consistent view of the evolution of land variables over several decades at an enhanced resolution compared to ERA5. ERA5-Land has been produced by replaying the land component of the ECMWF ERA5 climate reanalysis. Reanalysis combines model data with observations from across the world into a globally complete and consistent dataset using the laws of physics. Reanalysis produces data that goes several decades back in time, providing an accurate description of the climate of the past. Air temperature (2 m): Temperature of air at 2m above the surface of land, sea or in-land waters. 2m temperature is calculated by interpolating between the lowest model level and the Earth's surface, taking account of the atmospheric conditions. Processing steps: The original hourly ERA5-Land data has been spatially enhanced from 0.1 degree to 30 arc seconds (approx. 1000 m) spatial resolution by image fusion with CHELSA data (V1.2) (https://chelsa-climate.org/). For each day we used the corresponding monthly long-term average of CHELSA. The aim was to use the fine spatial detail of CHELSA and at the same time preserve the general regional pattern and fine temporal detail of ERA5-Land. The steps included aggregation and enhancement, specifically: 1. spatially aggregate CHELSA to the resolution of ERA5-Land 2. calculate difference of ERA5-Land - aggregated CHELSA 3. interpolate differences with a Gaussian filter to 30 arc seconds 4. add the interpolated differences to CHELSA The spatially enhanced daily ERA5-Land data has been aggregated on a weekly basis starting from Saturday for the time period 2016 - 2020. Data available is the weekly average of daily averages, the weekly minimum of daily minima and the weekly maximum of daily maxima of air temperature (2 m). File naming: Average of daily average: era5_land_t2m_avg_weekly_YYYY_MM_DD.tif Max of daily max: era5_land_t2m_max_weekly_YYYY_MM_DD.tif Min of daily min: era5_land_t2m_min_weekly_YYYY_MM_DD.tif The date in the file name determines the start day of the week (Saturday). Pixel value: °C * 10 Example: Value 44 = 4.4 °C The QML or SLD style files can be used for visualization of the temperature layers. Coordinate reference system: ETRS89 / LAEA Europe (EPSG:3035) (EPSG:3035) Spatial extent: north: 82:00:30N south: 18N west: 32:00:30W east: 70E Spatial resolution: 1km Temporal resolution: weekly Time period: 01/01/2016 - 12/31/2020 Format: GeoTIFF Representation type: Grid Software used: GDAL 3.2.2 and GRASS GIS 8.0.0 (r.resamp.stats -w; r.relief) Lineage: Dataset has been processed from original Copernicus Climate Data Store (ERA5-Land) data sources. As auxiliary data CHELSA climate data has been used. Original ERA5-Land dataset license: https://cds.climate.copernicus.eu/api/v2/terms/static/licence-to-use-copernicus-products.pdf CHELSA climatologies (V1.2): Data used: Karger D.N., Conrad, O., Böhner, J., Kawohl, T., Kreft, H., Soria-Auza, R.W., Zimmermann, N.E, Linder, H.P., Kessler, M. (2018): Data from: Climatologies at high resolution for the earth's land surface areas. Dryad digital repository. http://dx.doi.org/doi:10.5061/dryad.kd1d4 Original peer-reviewed publication: Karger, D.N., Conrad, O., Böhner, J., Kawohl, T., Kreft, H., Soria-Auza, R.W., Zimmermann, N.E., Linder, P., Kessler, M. (2017): Climatologies at high resolution for the Earth land surface areas. Scientific Data. 4 170122. https://doi.org/10.1038/sdata.2017.122 Other resources: https://data.mundialis.de/geonetwork/srv/eng/catalog.search#/metadata/601ea08c-0768-4af3-a8fa-7da25fb9125b Processed by: mundialis GmbH & Co. KG, Germany (https://www.mundialis.de/) Contact: mundialis GmbH & Co. KG, info@mundialis.de Acknowledgements: This study was partially funded by EU grant 874850 MOOD. The contents of this publication are the sole responsibility of the authors and don't necessarily reflect the views of the European Commission.